 9
9peptides
spectra
0.000 | 0.000
0.135 | 0.152
0.000 | 0.000
0.000 | 0.000
0.082 | 0.092
0.000 | 0.000
0.762 | 0.774
0.000 | 0.000
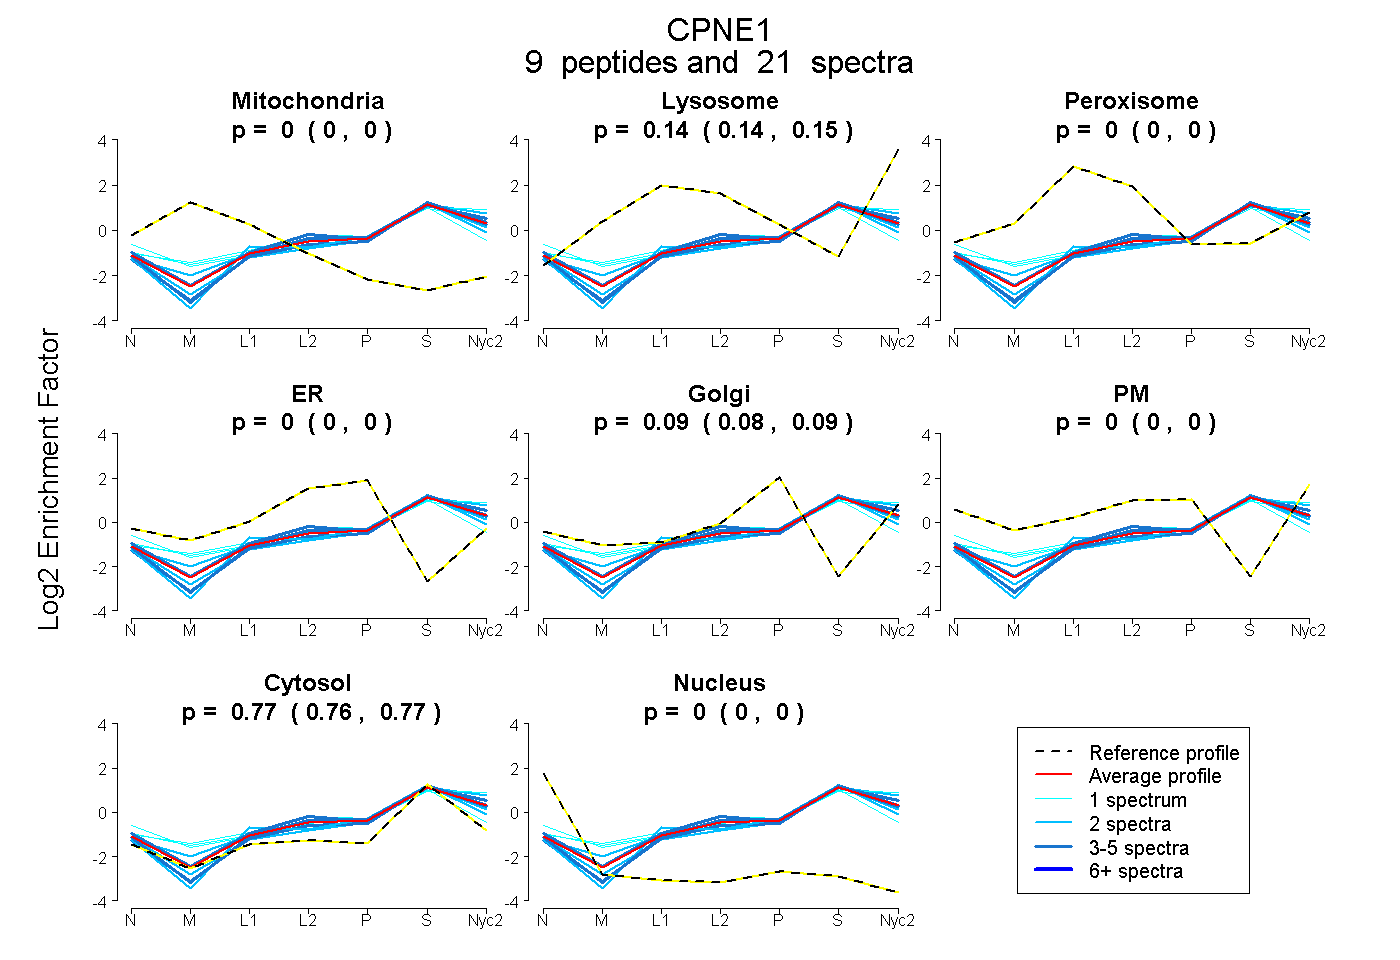
| Plot | Mito | Lyso | Perox | ER | Golgi | PM | Cytosol | Nucleus | |||||
| Expt A |
9 peptides |
21 spectra |
|
0.000 0.000 | 0.000 |
0.144 0.135 | 0.152 |
0.000 0.000 | 0.000 |
0.000 0.000 | 0.000 |
0.087 0.082 | 0.092 |
0.000 0.000 | 0.000 |
0.769 0.762 | 0.774 |
0.000 0.000 | 0.000 |
| 2 spectra, AQGWAPLK | 0.000 | 0.229 | 0.000 | 0.000 | 0.044 | 0.000 | 0.726 | 0.000 | ||
| 4 spectra, VVTMEVEAR | 0.000 | 0.160 | 0.000 | 0.000 | 0.006 | 0.090 | 0.744 | 0.000 | ||
| 2 spectra, TLPAPAK | 0.000 | 0.062 | 0.000 | 0.000 | 0.096 | 0.000 | 0.842 | 0.000 | ||
| 1 spectrum, LYGPTNFAPIINHVAR | 0.000 | 0.000 | 0.120 | 0.031 | 0.139 | 0.000 | 0.711 | 0.000 | ||
| 4 spectra, WHLAYR | 0.000 | 0.100 | 0.000 | 0.000 | 0.097 | 0.000 | 0.803 | 0.000 | ||
| 4 spectra, SDPFLEFFR | 0.000 | 0.101 | 0.000 | 0.000 | 0.067 | 0.000 | 0.833 | 0.000 | ||
| 1 spectrum, NNLNPTWK | 0.000 | 0.278 | 0.000 | 0.000 | 0.056 | 0.023 | 0.643 | 0.000 | ||
| 1 spectrum, FAAQAAQQR | 0.000 | 0.108 | 0.000 | 0.000 | 0.000 | 0.201 | 0.691 | 0.000 | ||
| 2 spectra, DIVQFVPYR | 0.000 | 0.068 | 0.000 | 0.000 | 0.104 | 0.000 | 0.828 | 0.000 |
| Plot | Mito | Lyso or Perox | ER | Golgi | PM | Cytosol | Nucleus | ||||||
| Expt B |
4 peptides |
7 spectra |
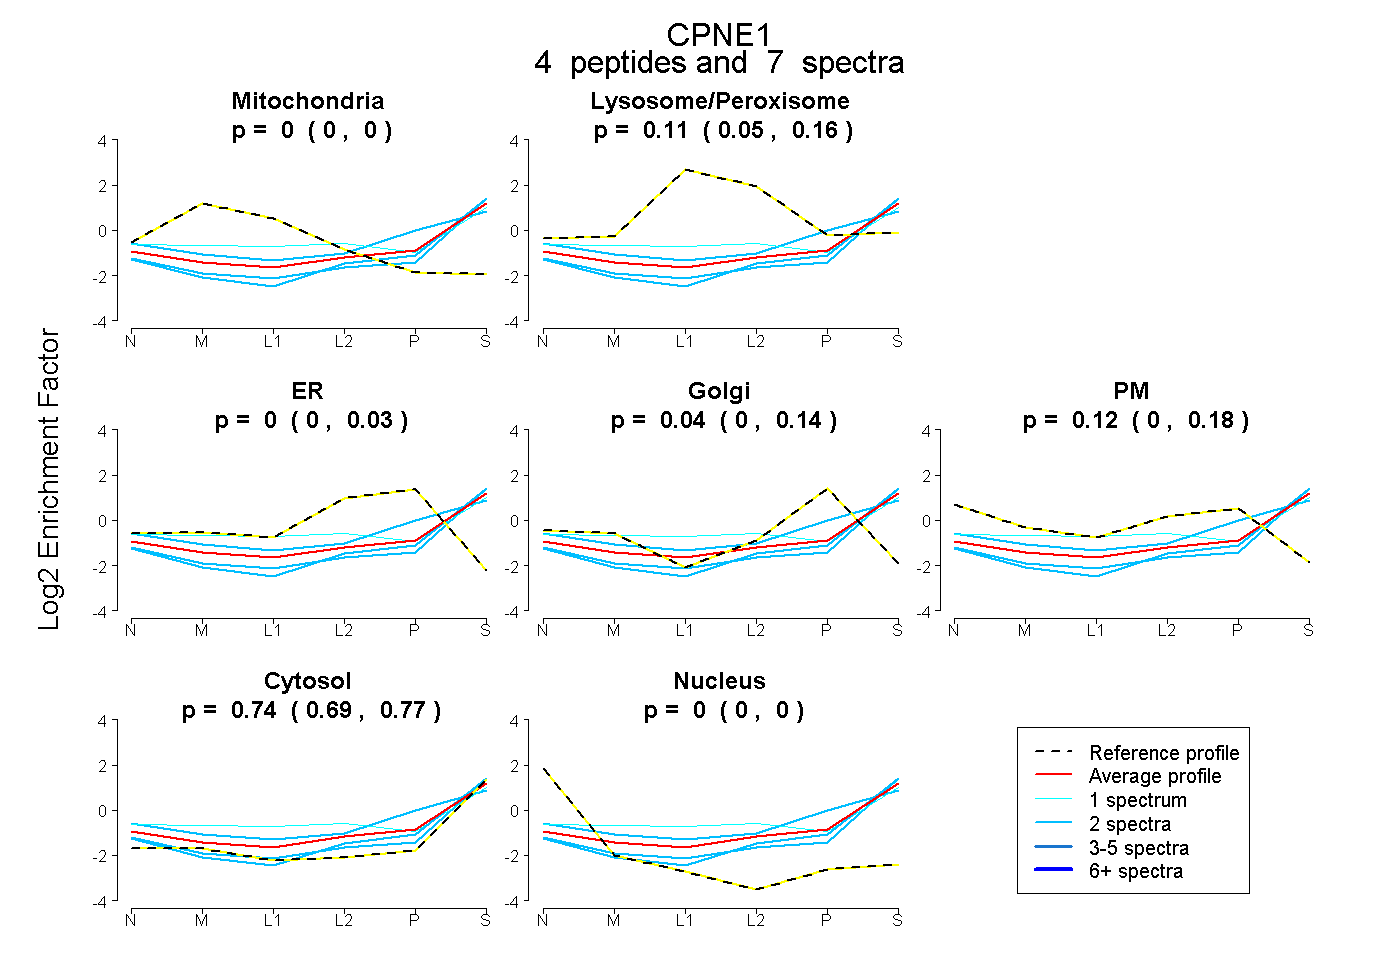 |
0.000 0.000 | 0.000 |
0.109 0.047 | 0.161 |
0.000 0.000 | 0.027 |
0.036 0.000 | 0.135 |
0.117 0.000 | 0.181 |
0.737 0.693 | 0.769 |
0.000 0.000 | 0.000 |
|||
| Plot | Lyso | Other | |||||||||||
| Expt C |
6 peptides |
18 spectra |
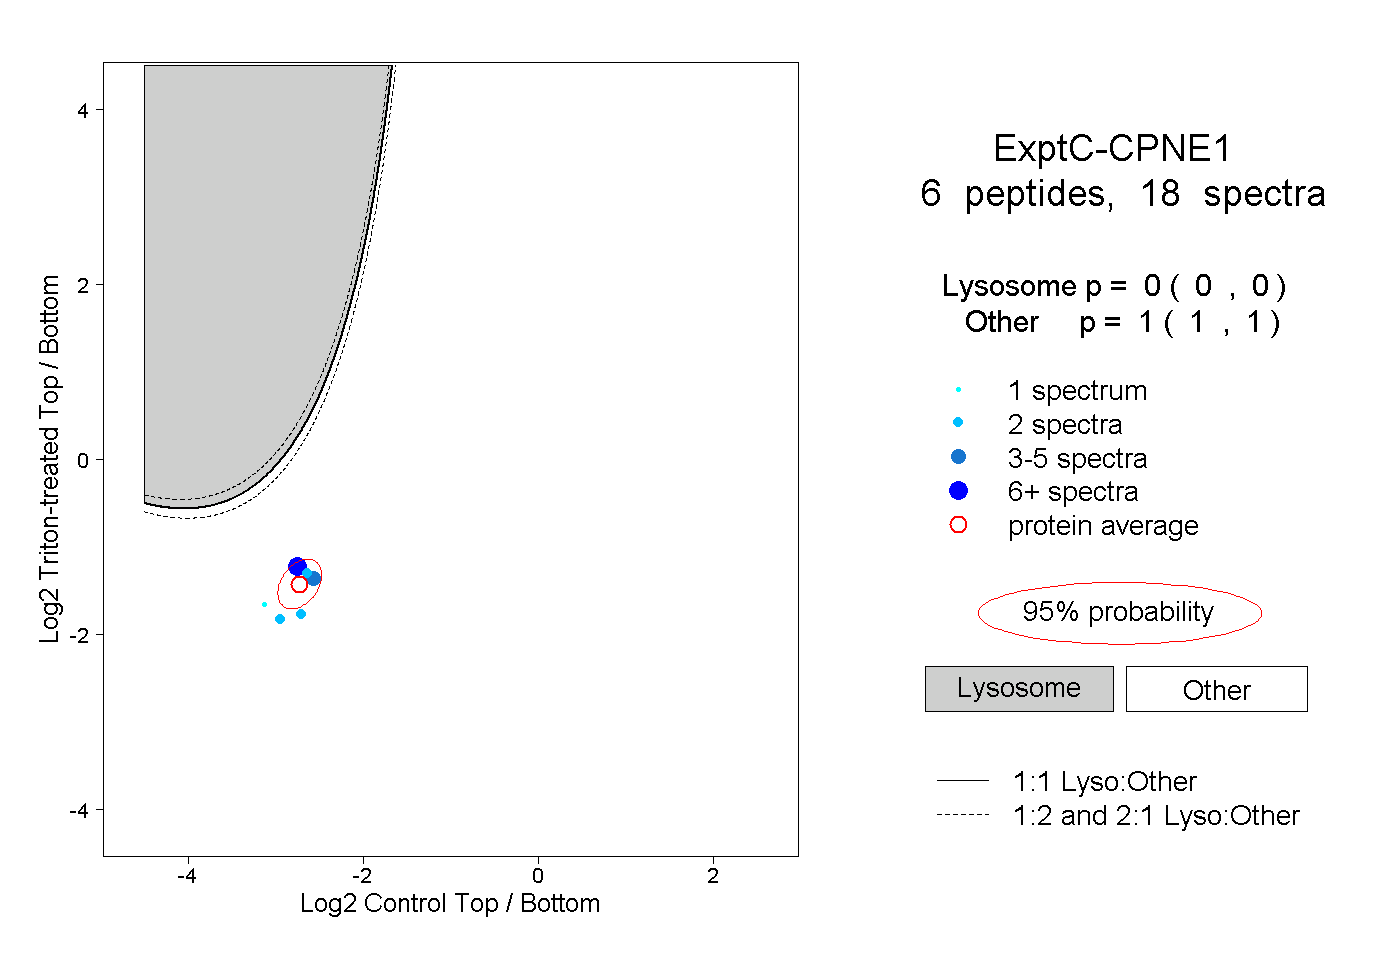 |
0.000 0.000 | 0.000 |
1.000 1.000 | 1.000 |
||||||||
| Plot | Lyso | Other | |||||||||||
| Expt D |
2 peptides |
5 spectra |
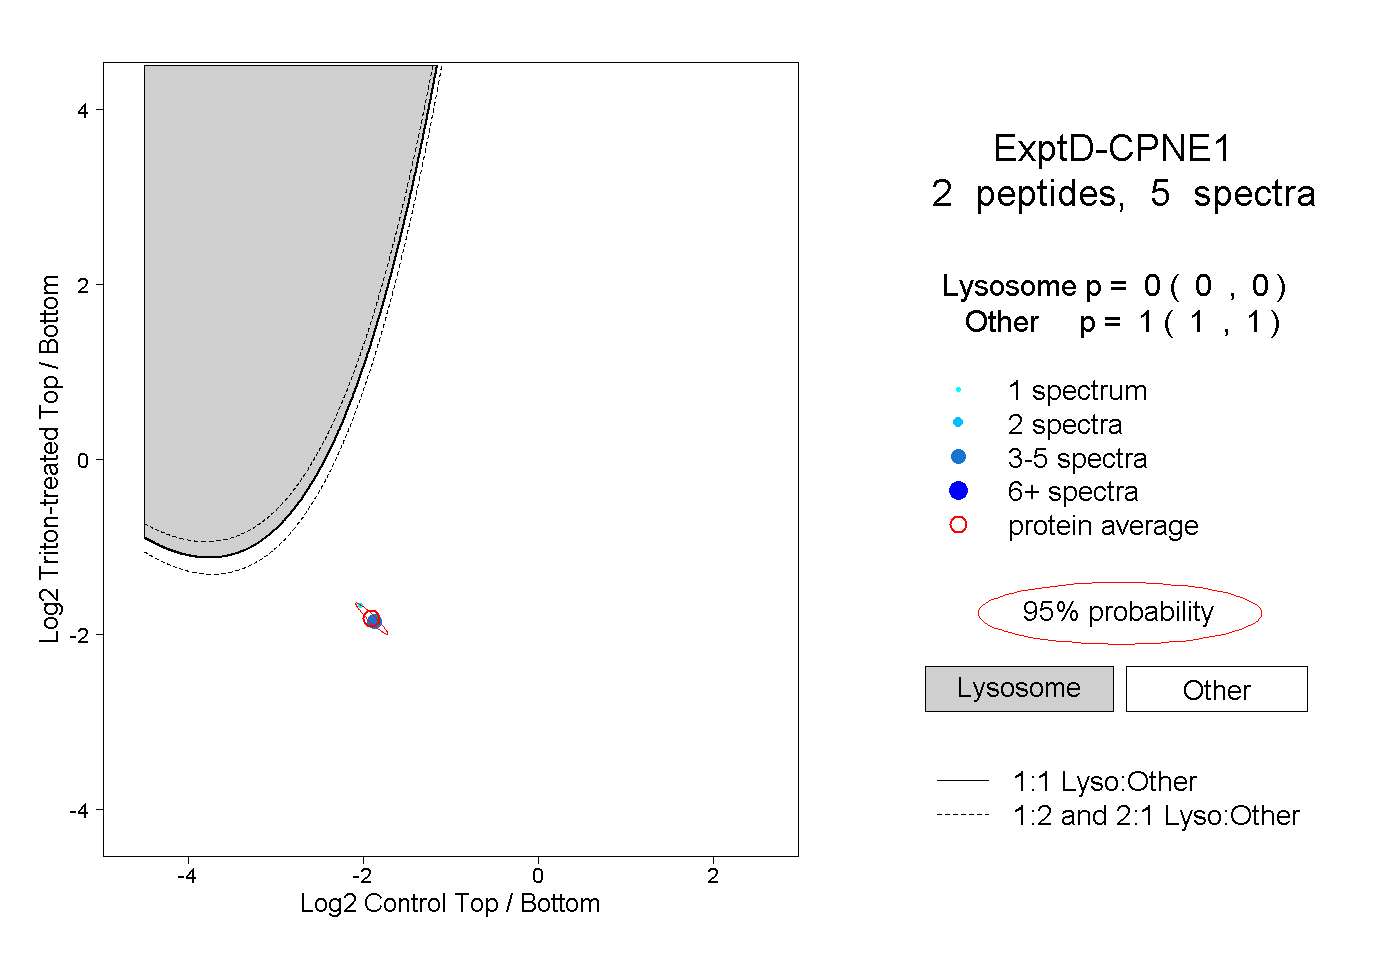 |
0.000 0.000 | 0.000 |
1.000 1.000 | 1.000 |