 3
3peptides
spectra
0.765 | 0.913
0.000 | 0.000
0.000 | 0.109
0.000 | 0.060
0.000 | 0.001
0.000 | 0.049
0.000 | 0.071
0.027 | 0.094
| Plot | Mito | Lyso | Perox | ER | Golgi | PM | Cytosol | Nucleus | |||||
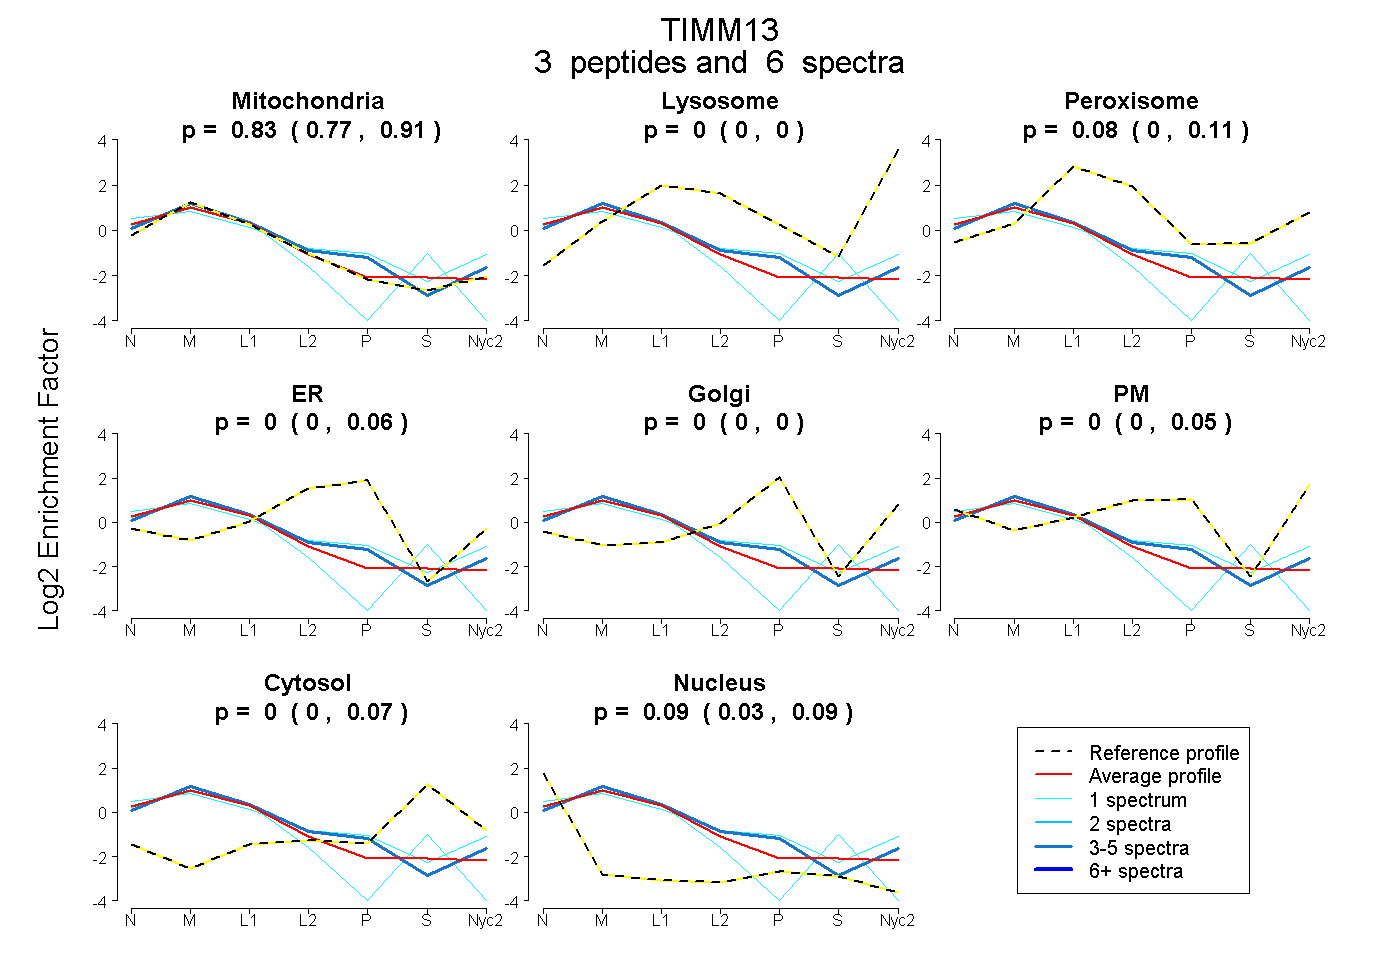
| Expt A |
3 peptides |
6 spectra |
|
0.832 0.765 | 0.913 |
0.000 0.000 | 0.000 |
0.078 0.000 | 0.109 |
0.000 0.000 | 0.060 |
0.000 0.000 | 0.001 |
0.000 0.000 | 0.049 |
0.004 0.000 | 0.071 |
0.085 0.027 | 0.094 |
| 1 spectrum, CIAMCMDR | 0.660 | 0.000 | 0.000 | 0.000 | 0.000 | 0.291 | 0.000 | 0.049 | ||
| 1 spectrum, LDPGAIMEQVK | 0.820 | 0.000 | 0.000 | 0.000 | 0.000 | 0.000 | 0.017 | 0.162 | ||
| 4 spectra, YMDAWNTVSR | 0.822 | 0.000 | 0.000 | 0.066 | 0.037 | 0.075 | 0.000 | 0.000 |
| Plot | Mito | Lyso or Perox | ER | Golgi | PM | Cytosol | Nucleus | ||||||
| Expt B |
2 peptides |
9 spectra |
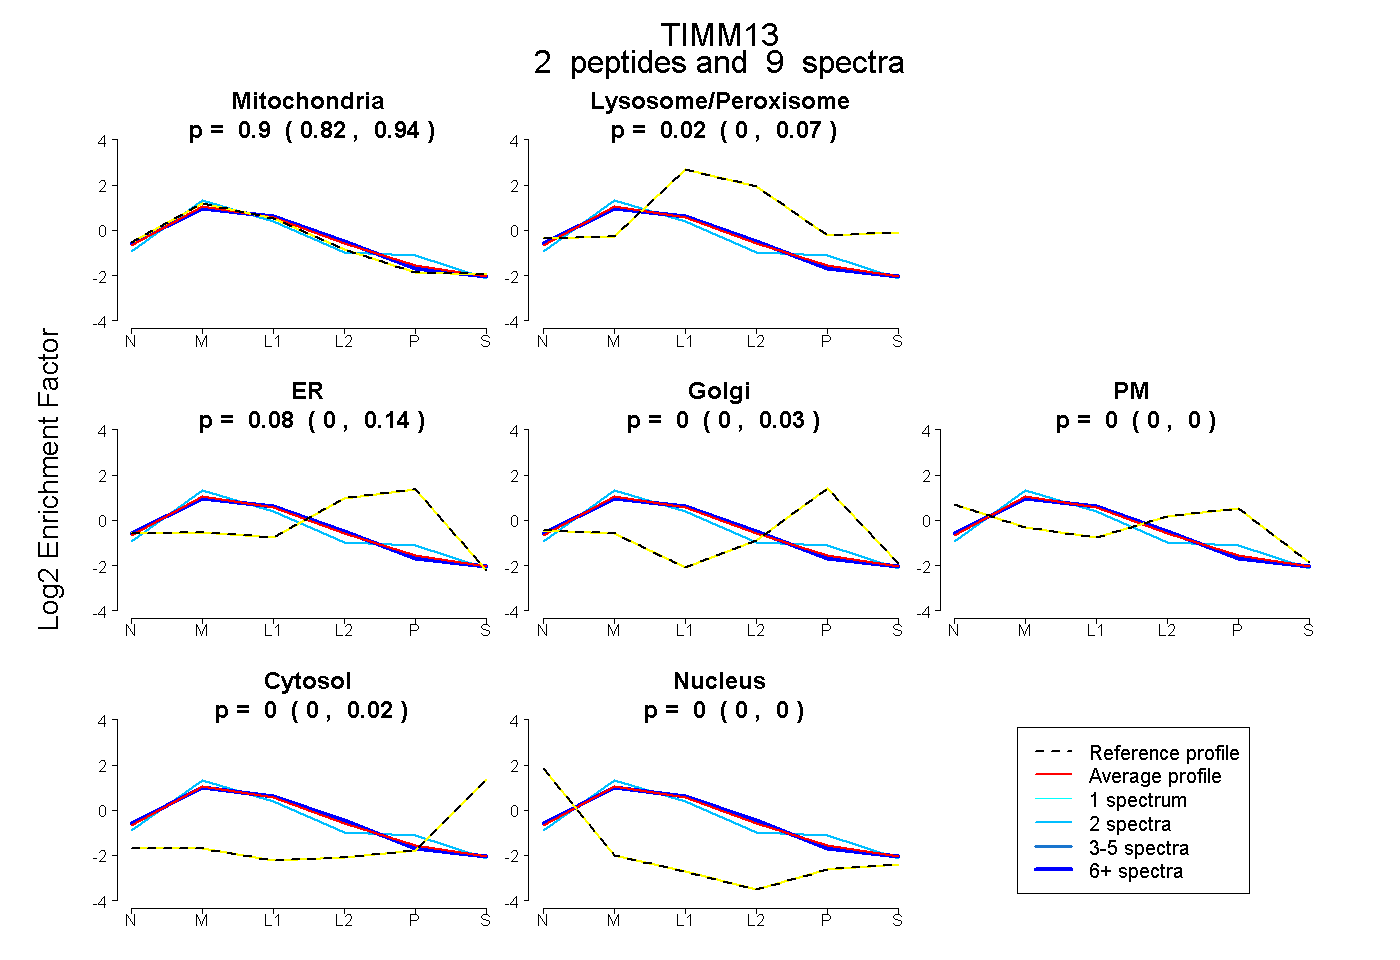 |
0.897 0.822 | 0.944 |
0.021 0.000 | 0.073 |
0.082 0.000 | 0.138 |
0.000 0.000 | 0.025 |
0.000 0.000 | 0.000 |
0.000 0.000 | 0.018 |
0.000 0.000 | 0.000 |
|||
| Plot | Lyso | Other | |||||||||||
| Expt C |
6 peptides |
38 spectra |
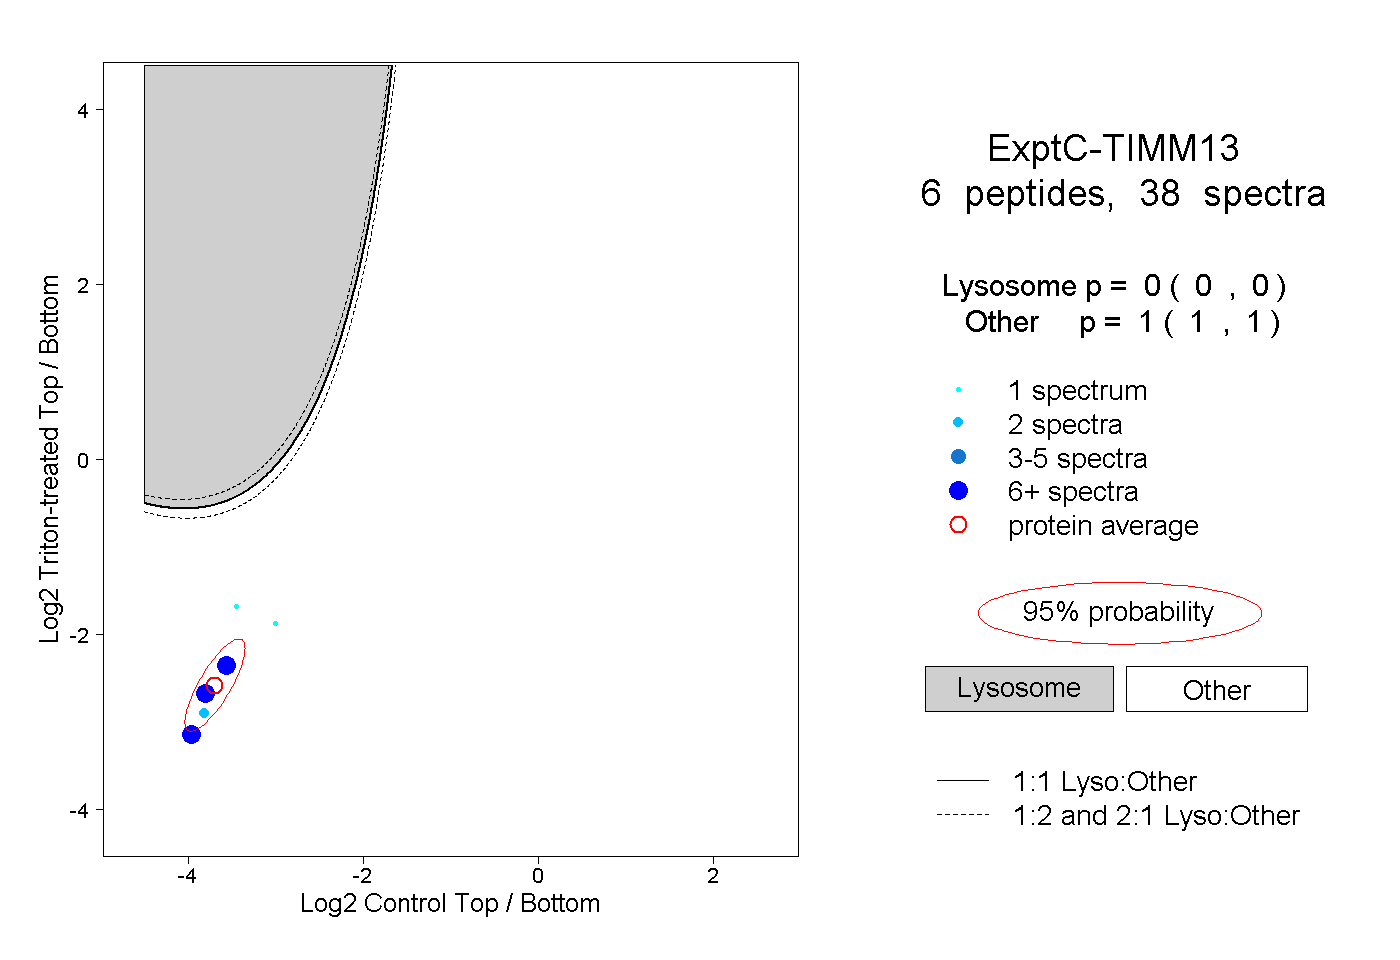 |
0.000 0.000 | 0.000 |
1.000 1.000 | 1.000 |
||||||||
| Plot | Lyso | Other | |||||||||||
| Expt D |
1 peptide |
4 spectra |
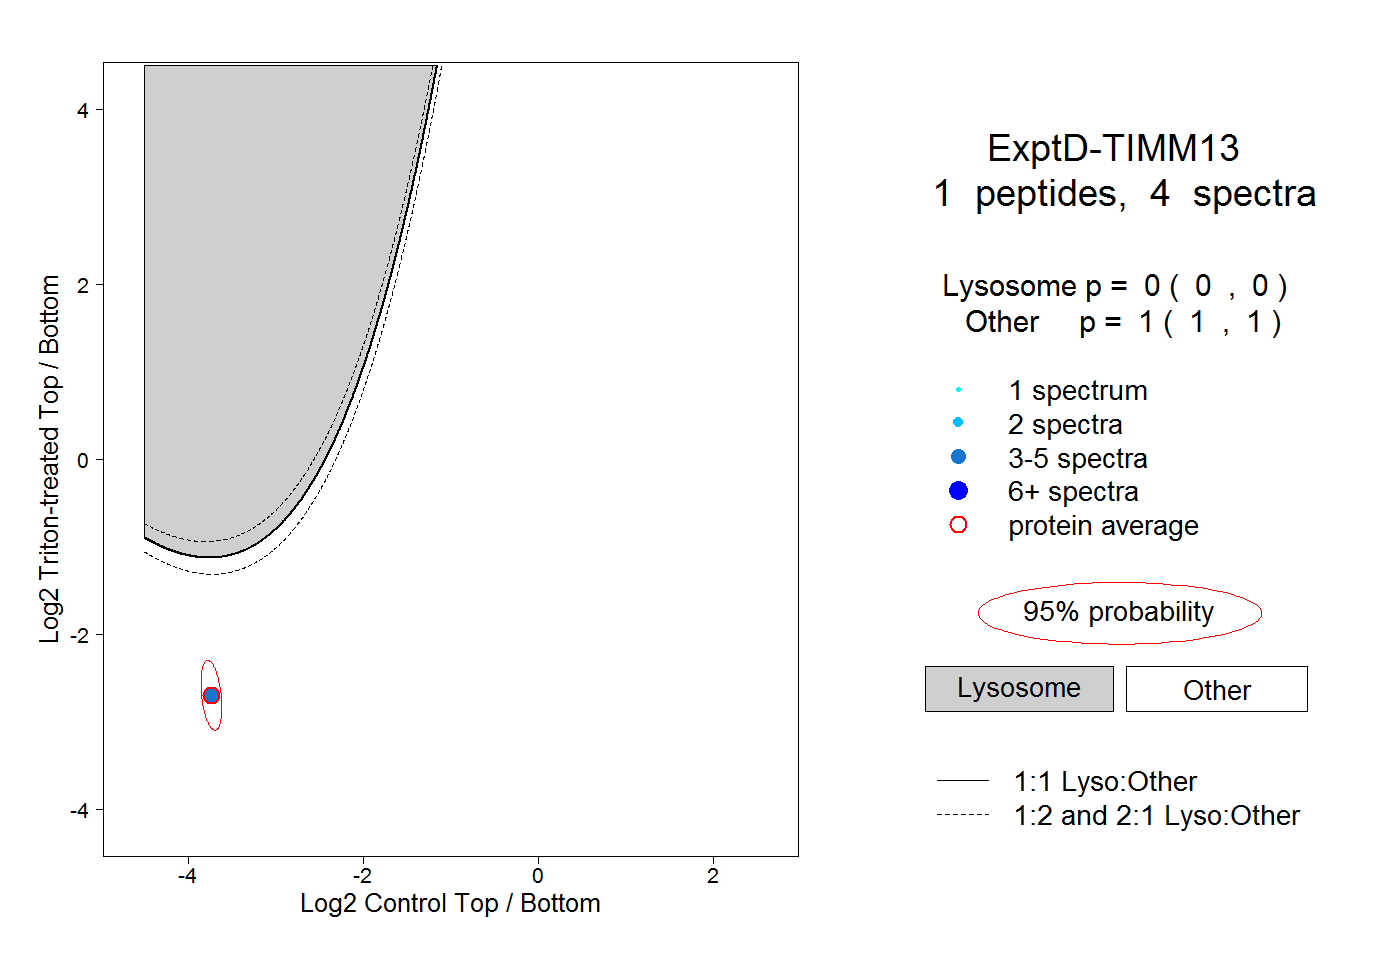 |
0.000 0.000 | 0.000 |
1.000 1.000 | 1.000 |