 5
5peptides
spectra
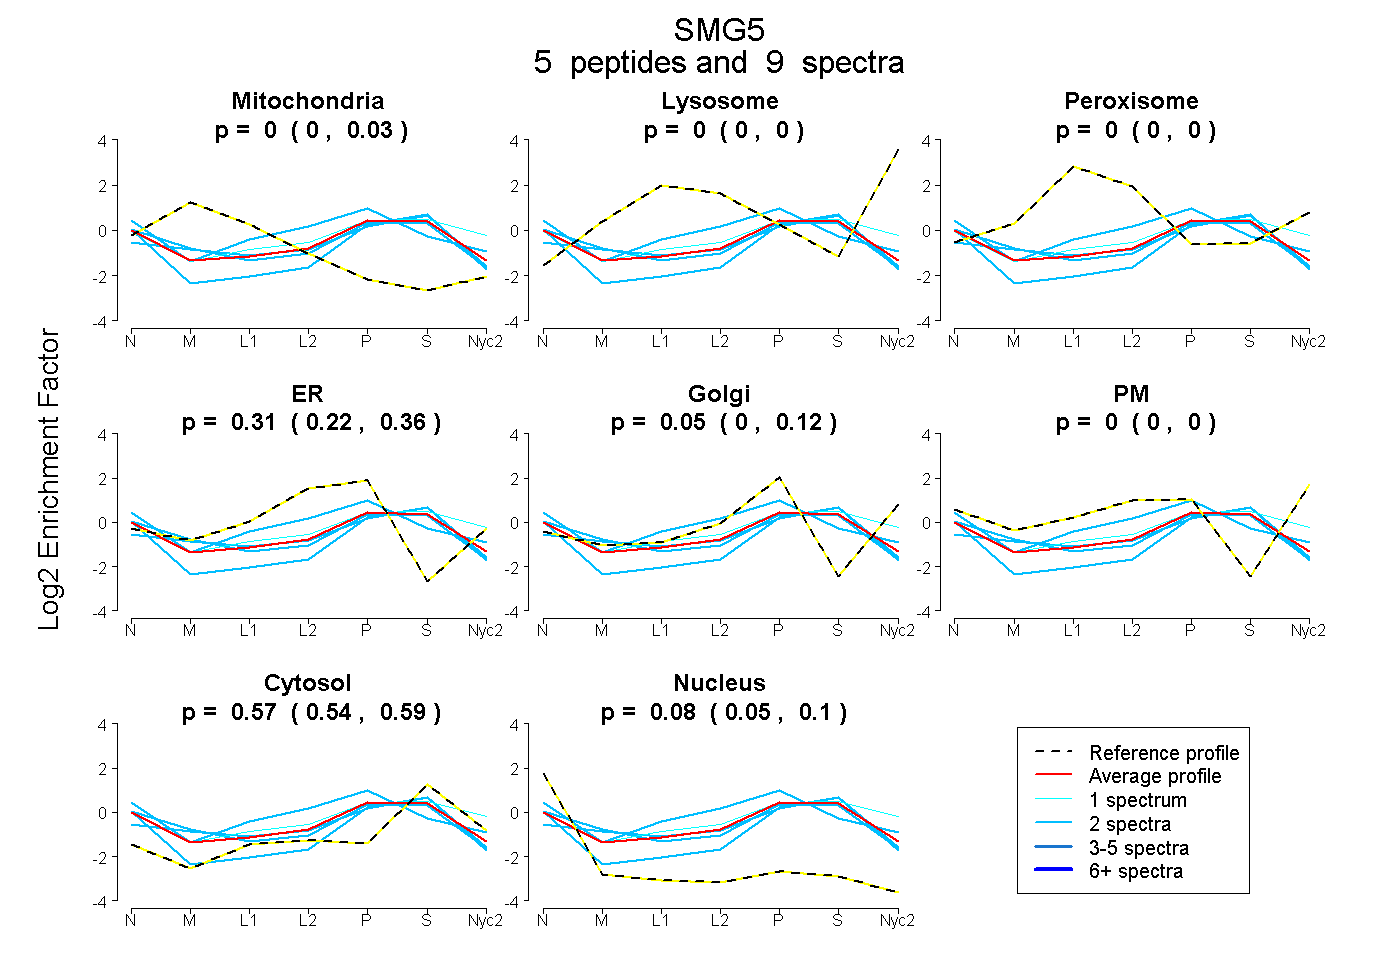
0.000 | 0.028
0.000 | 0.000
0.000 | 0.000
0.216 | 0.358
0.000 | 0.123
0.000 | 0.000
0.538 | 0.586
0.055 | 0.097
| Plot | Mito | Lyso | Perox | ER | Golgi | PM | Cytosol | Nucleus | |||||
| Expt A |
5 peptides |
9 spectra |
|
0.000 0.000 | 0.028 |
0.000 0.000 | 0.000 |
0.000 0.000 | 0.000 |
0.308 0.216 | 0.358 |
0.045 0.000 | 0.123 |
0.000 0.000 | 0.000 |
0.567 0.538 | 0.586 |
0.080 0.055 | 0.097 |
| 2 spectra, AVVEAVHR | 0.000 | 0.000 | 0.041 | 0.521 | 0.000 | 0.014 | 0.375 | 0.048 | ||
| 2 spectra, KPVSASGK | 0.110 | 0.000 | 0.000 | 0.189 | 0.107 | 0.000 | 0.511 | 0.083 | ||
| 2 spectra, LMFLHPVDYGR | 0.128 | 0.000 | 0.000 | 0.237 | 0.000 | 0.000 | 0.635 | 0.000 | ||
| 2 spectra, FIIIIPR | 0.000 | 0.000 | 0.000 | 0.000 | 0.185 | 0.000 | 0.628 | 0.187 | ||
| 1 spectrum, VFLDWLR | 0.000 | 0.000 | 0.017 | 0.037 | 0.155 | 0.218 | 0.574 | 0.000 |
| Plot | Mito | Lyso or Perox | ER | Golgi | PM | Cytosol | Nucleus | ||||||
| Expt B |
1 peptide |
1 spectrum |
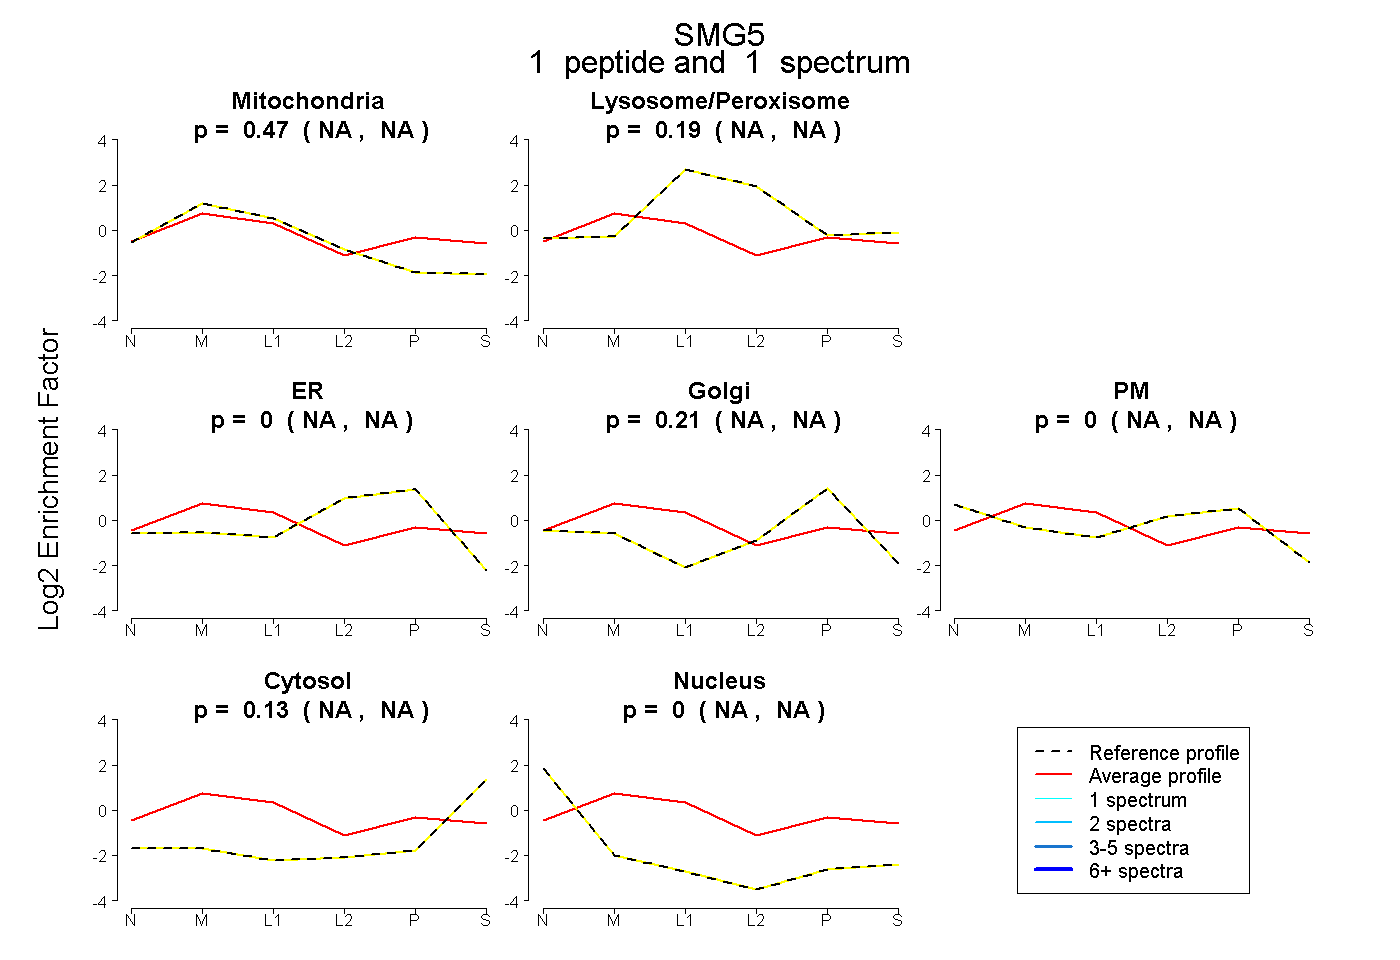 |
0.467 NA | NA |
0.191 NA | NA |
0.000 NA | NA |
0.209 NA | NA |
0.000 NA | NA |
0.133 NA | NA |
0.000 NA | NA |
|||
| Plot | Lyso | Other | |||||||||||
| Expt C |
2 peptides |
2 spectra |
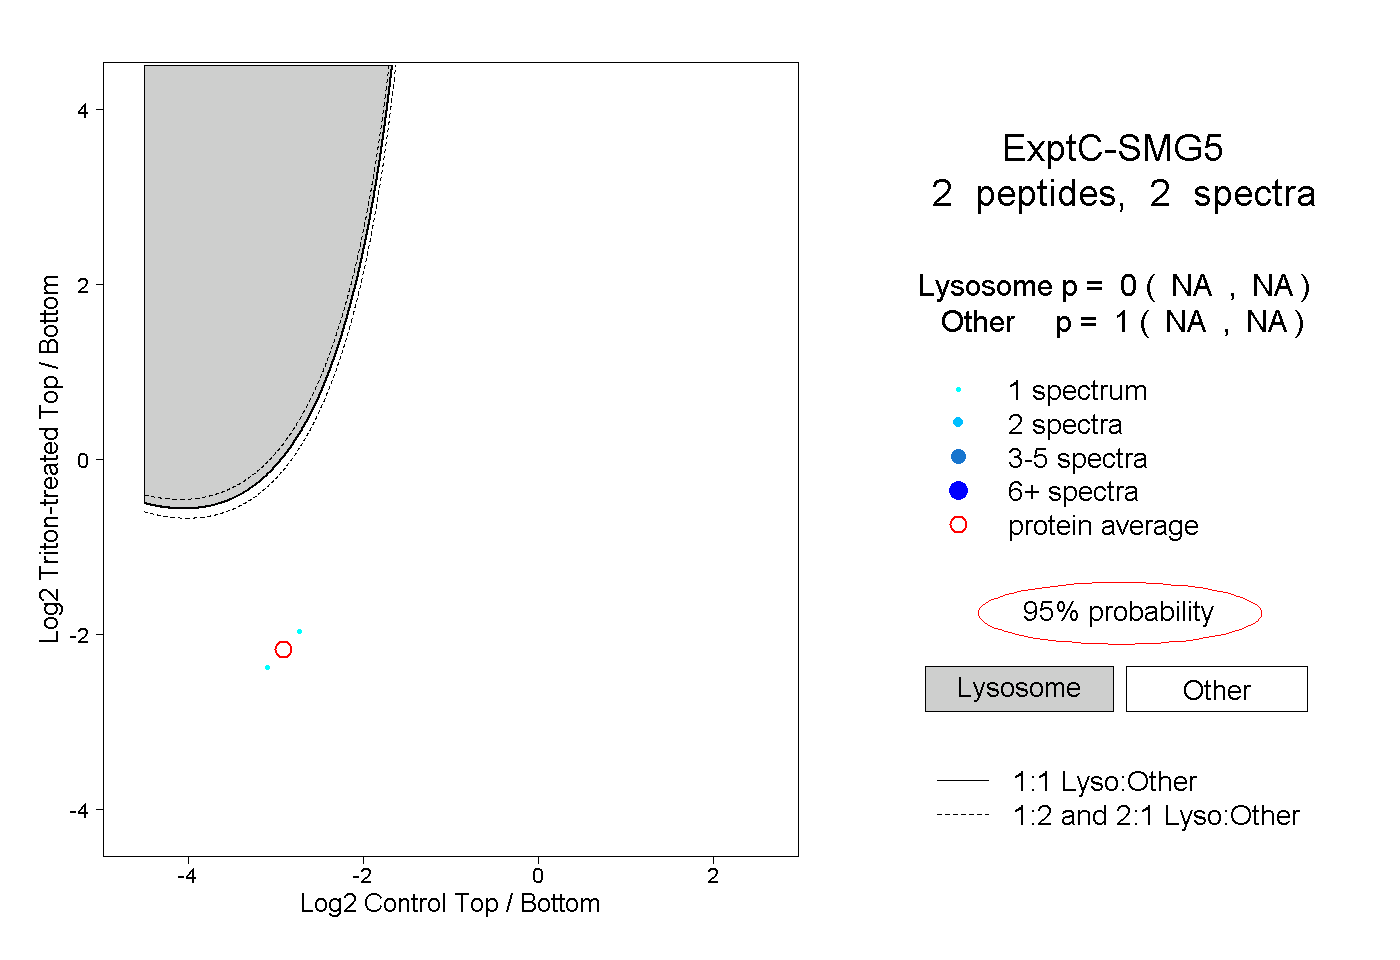 |
0.000 NA | NA |
1.000 NA | NA |