 6
6peptides
spectra
0.000 | 0.000
0.000 | 0.000
0.000 | 0.000
0.000 | 0.046
0.411 | 0.488
0.000 | 0.000
0.416 | 0.441
0.080 | 0.111
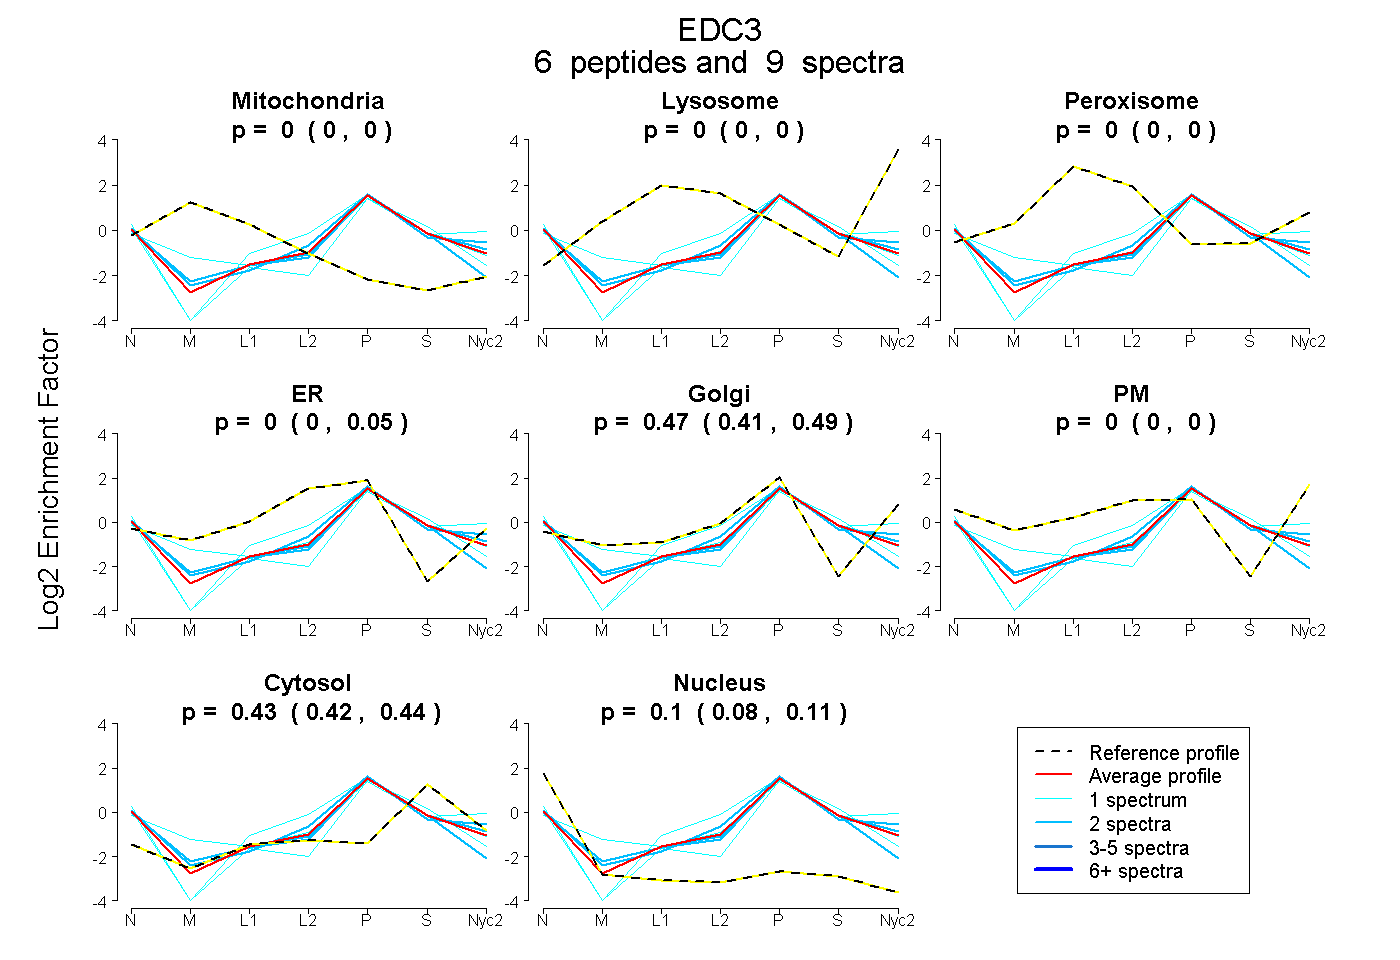
| Plot | Mito | Lyso | Perox | ER | Golgi | PM | Cytosol | Nucleus | |||||
| Expt A |
6 peptides |
9 spectra |
|
0.000 0.000 | 0.000 |
0.000 0.000 | 0.000 |
0.000 0.000 | 0.000 |
0.000 0.000 | 0.046 |
0.474 0.411 | 0.488 |
0.000 0.000 | 0.000 |
0.429 0.416 | 0.441 |
0.097 0.080 | 0.111 |