 3
3peptides
spectra
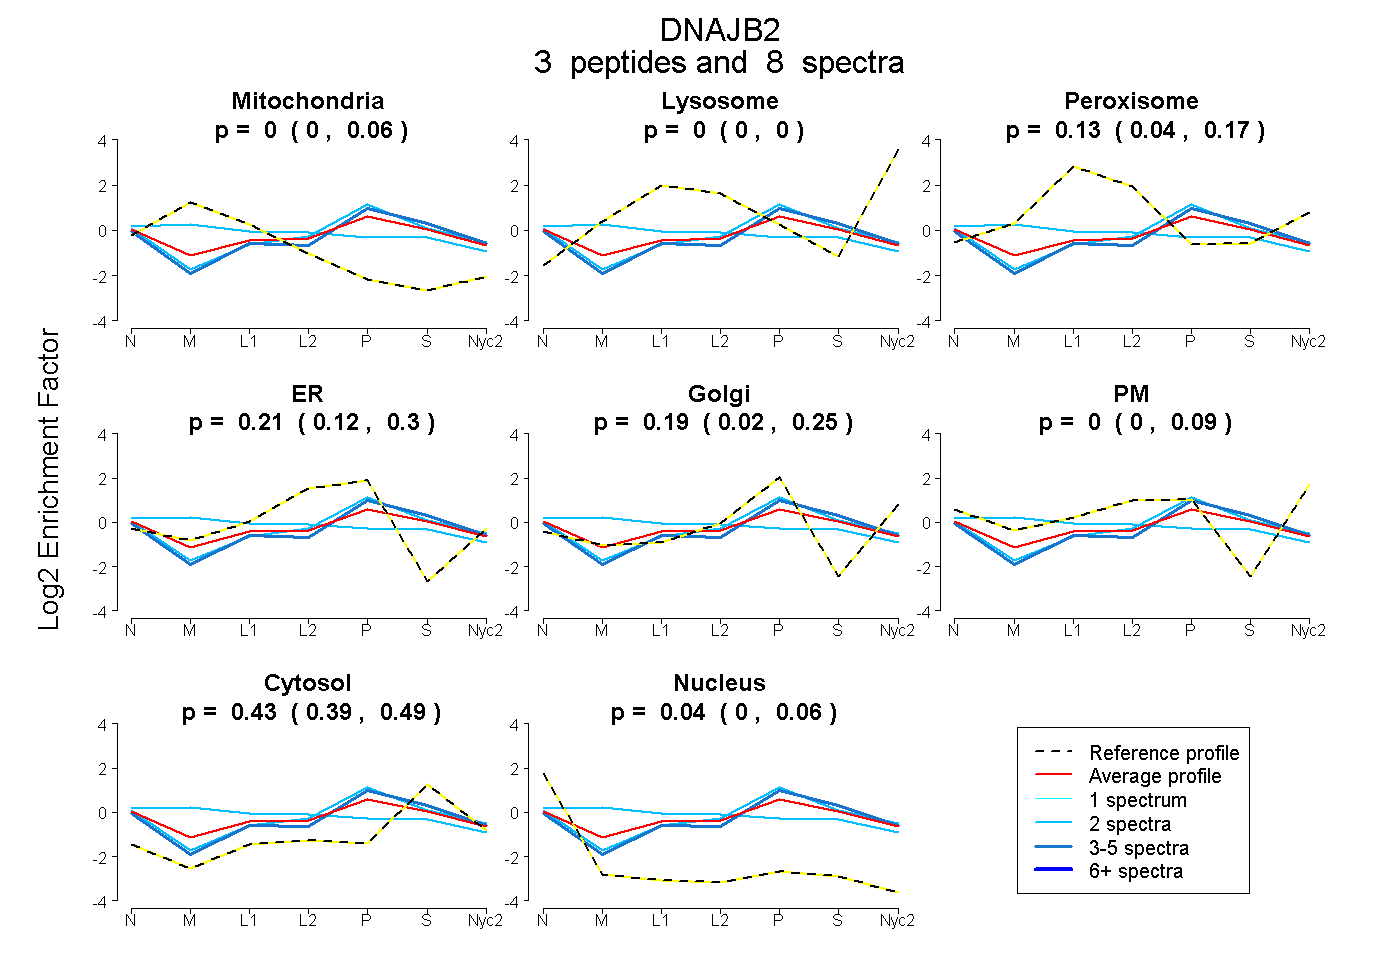
0.000 | 0.062
0.000 | 0.000
0.039 | 0.173
0.125 | 0.304
0.022 | 0.249
0.000 | 0.086
0.388 | 0.488
0.000 | 0.061
2peptides
spectra
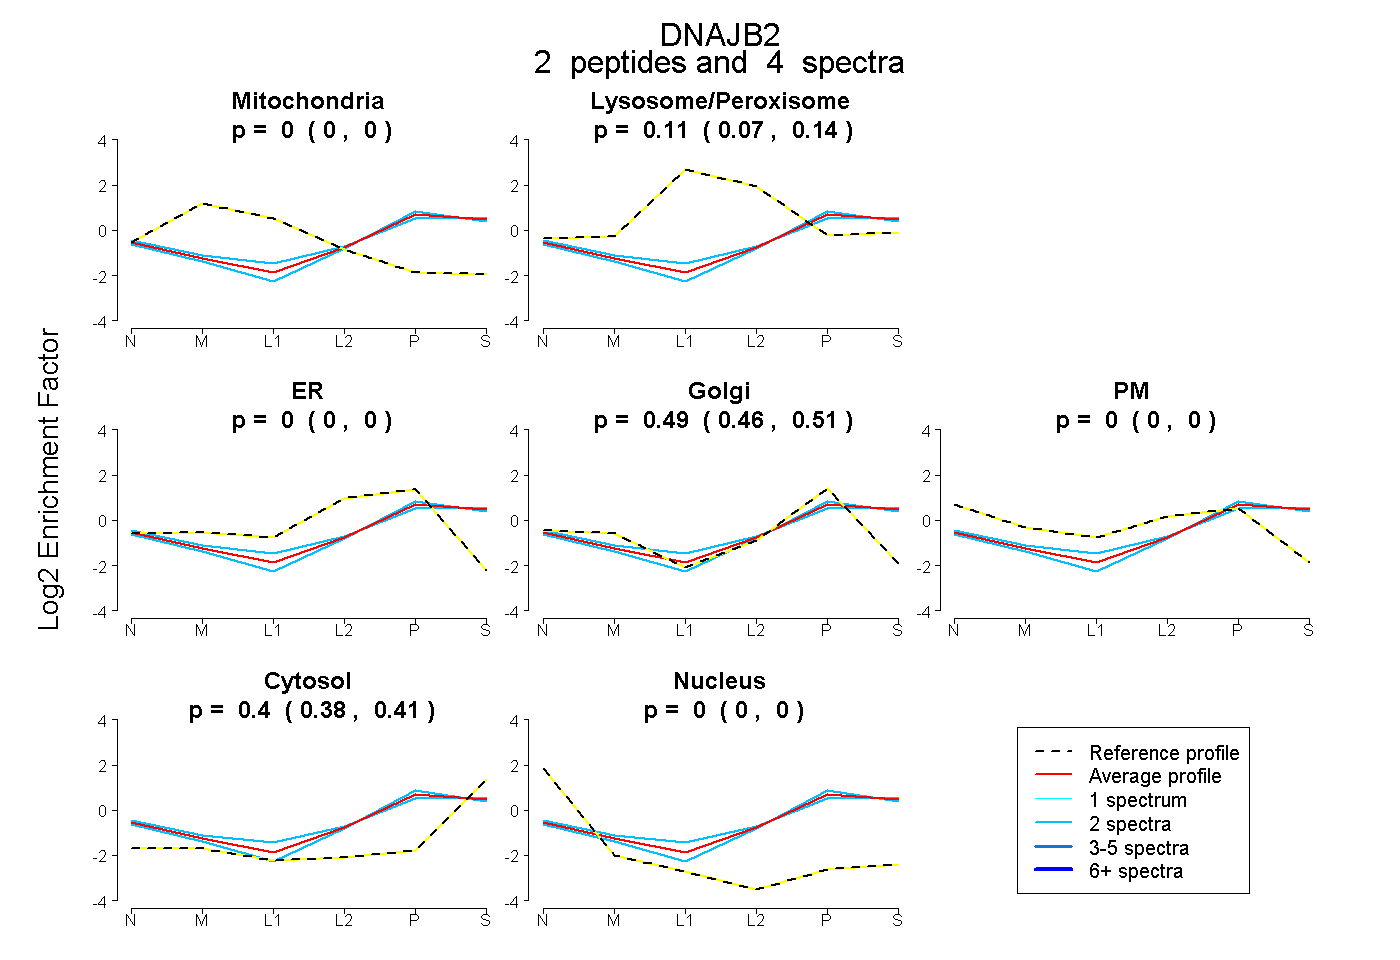
0.000 | 0.000
0.074 | 0.136
0.000 | 0.000
0.463 | 0.511
0.000 | 0.000
0.385 | 0.415
0.000 | 0.000
5peptides
spectra
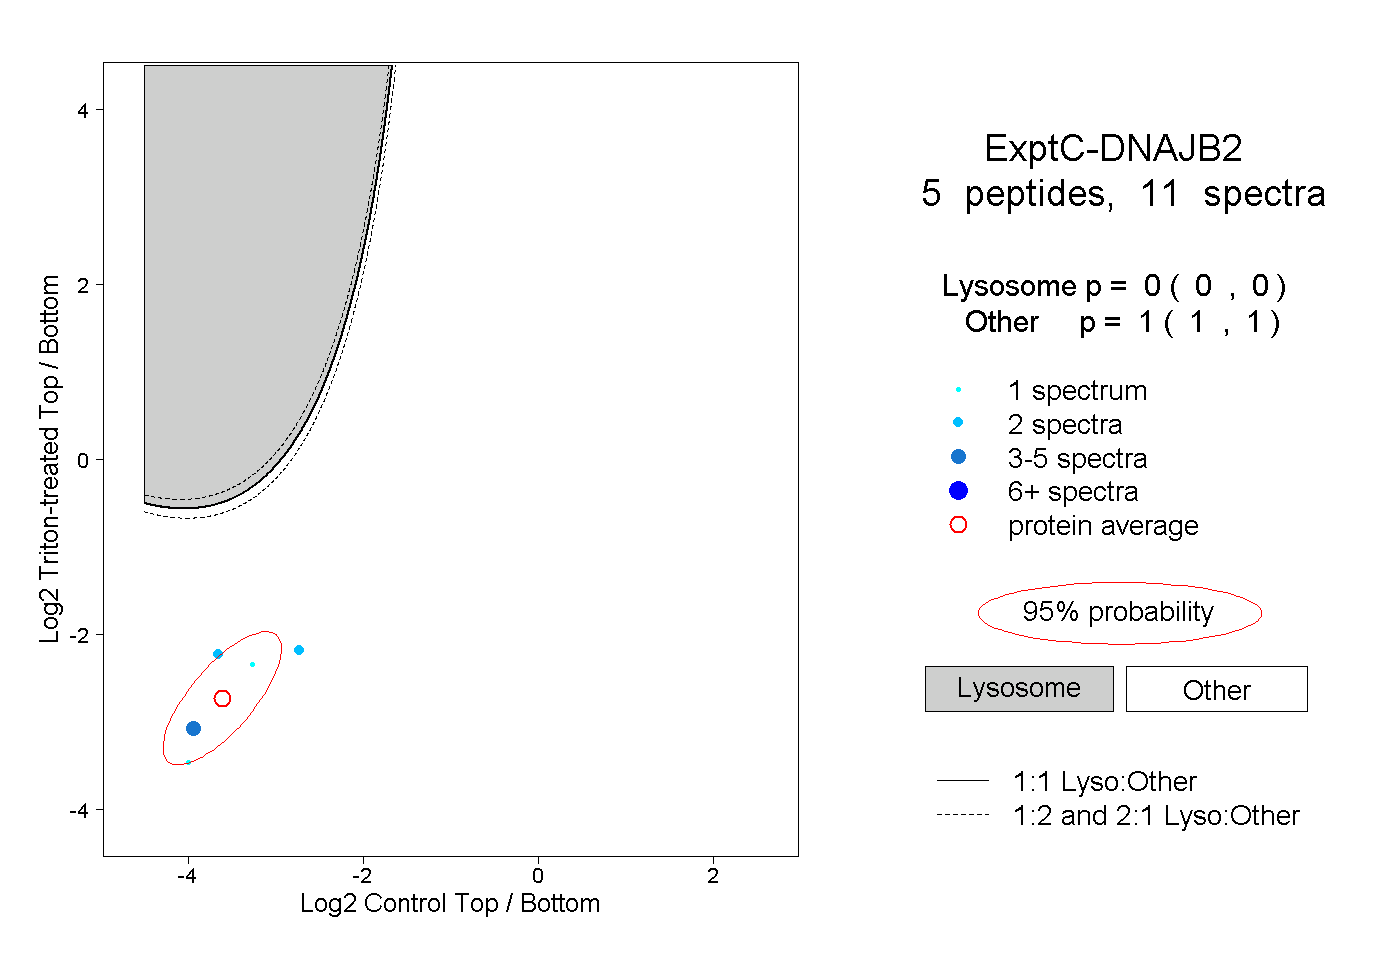
0.000 | 0.000
1.000 | 1.000
1peptide
spectrum
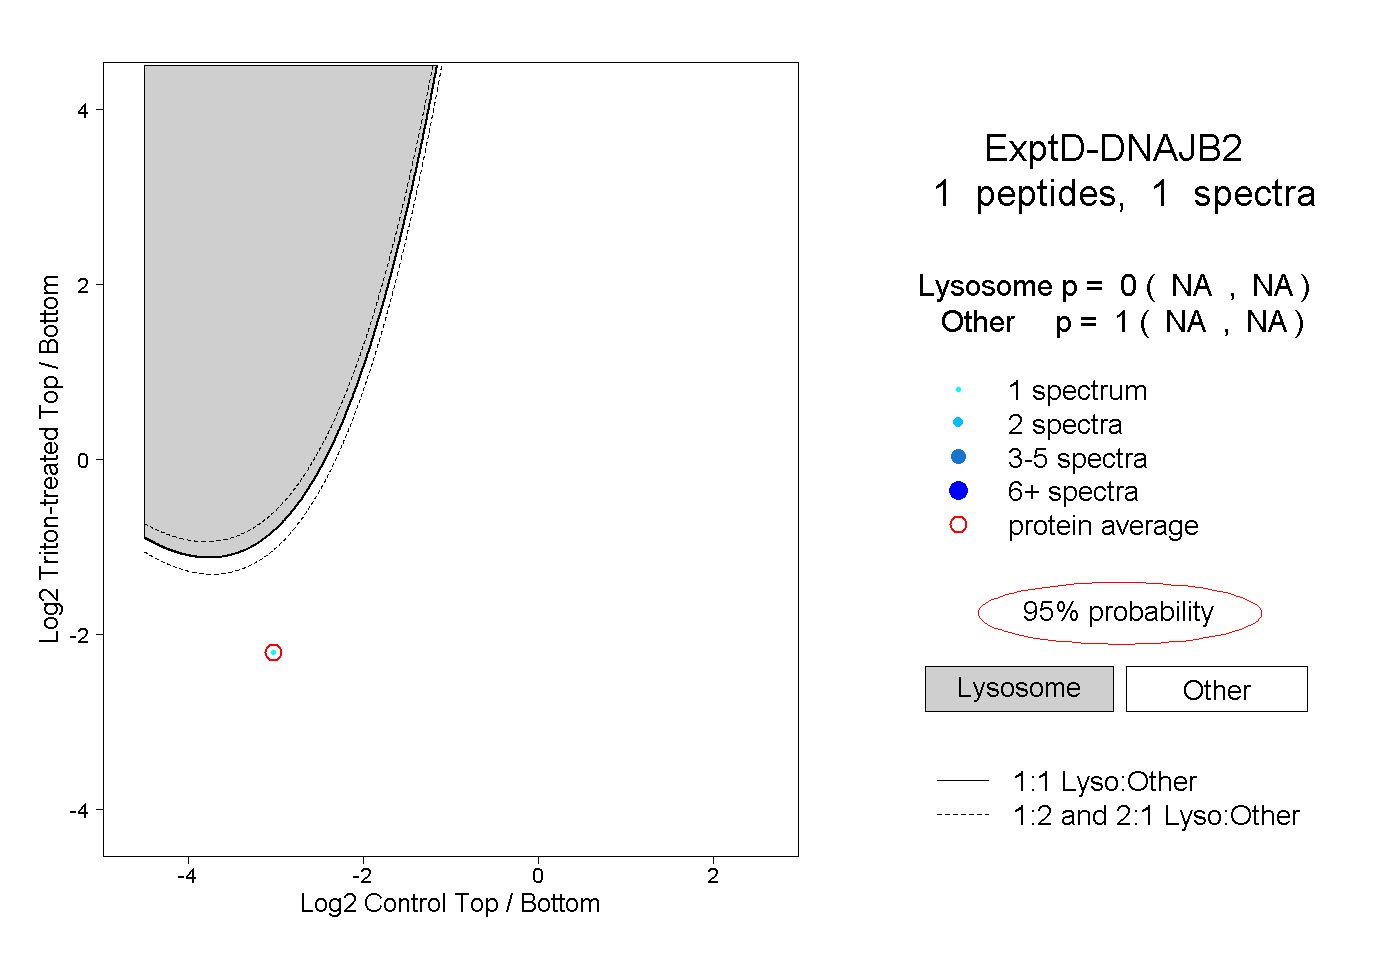
NA | NA
NA | NA