8
8peptides
spectra
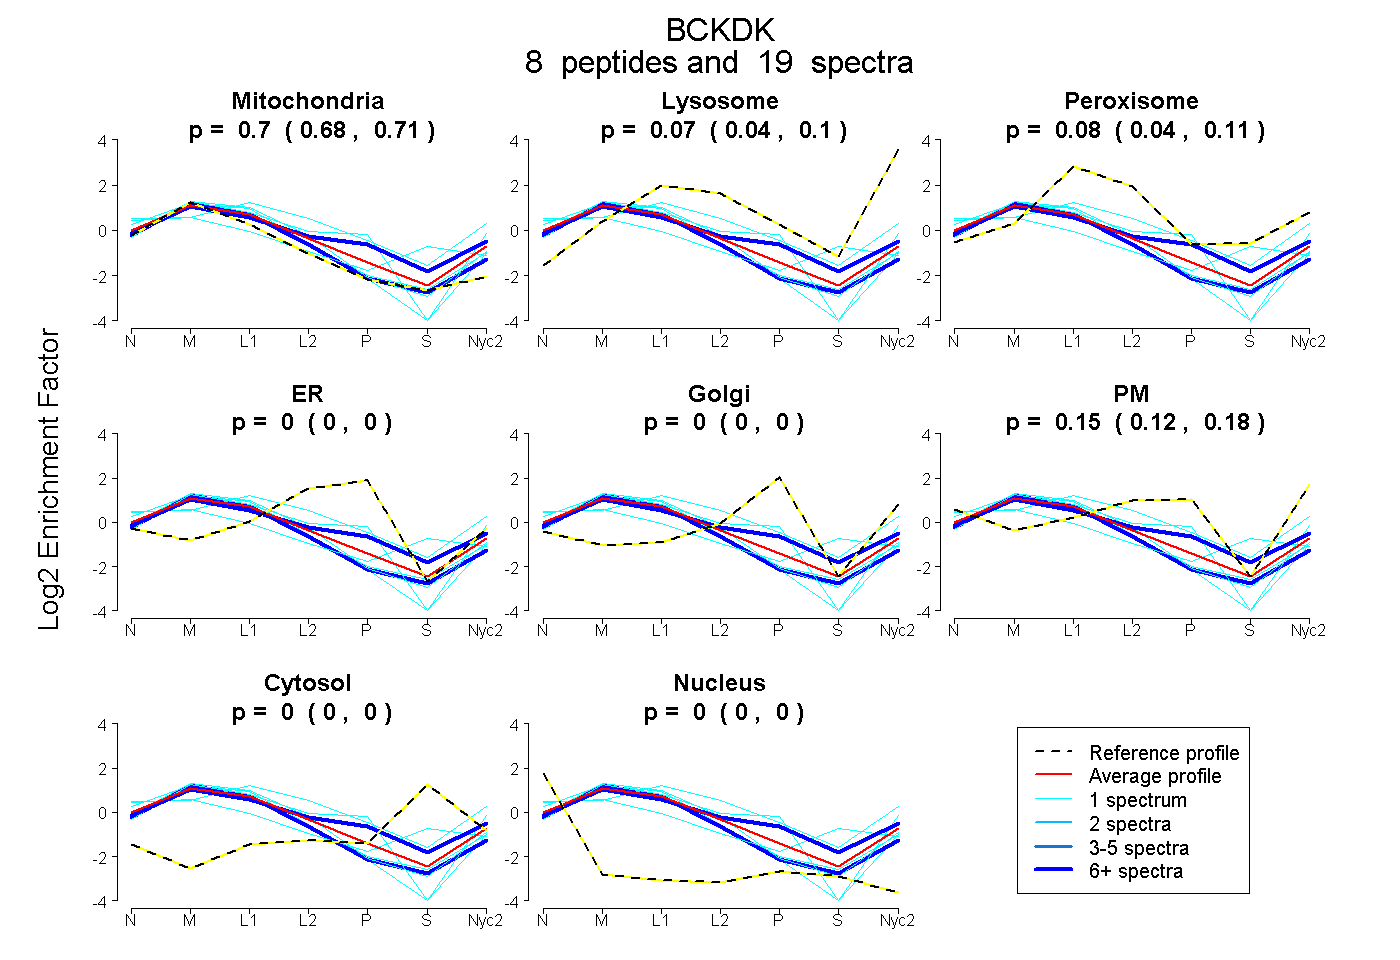
0.676 | 0.714
0.042 | 0.096
0.044 | 0.108
0.000 | 0.000
0.000 | 0.000
0.123 | 0.175
0.000 | 0.000
0.000 | 0.000
3peptides
spectra
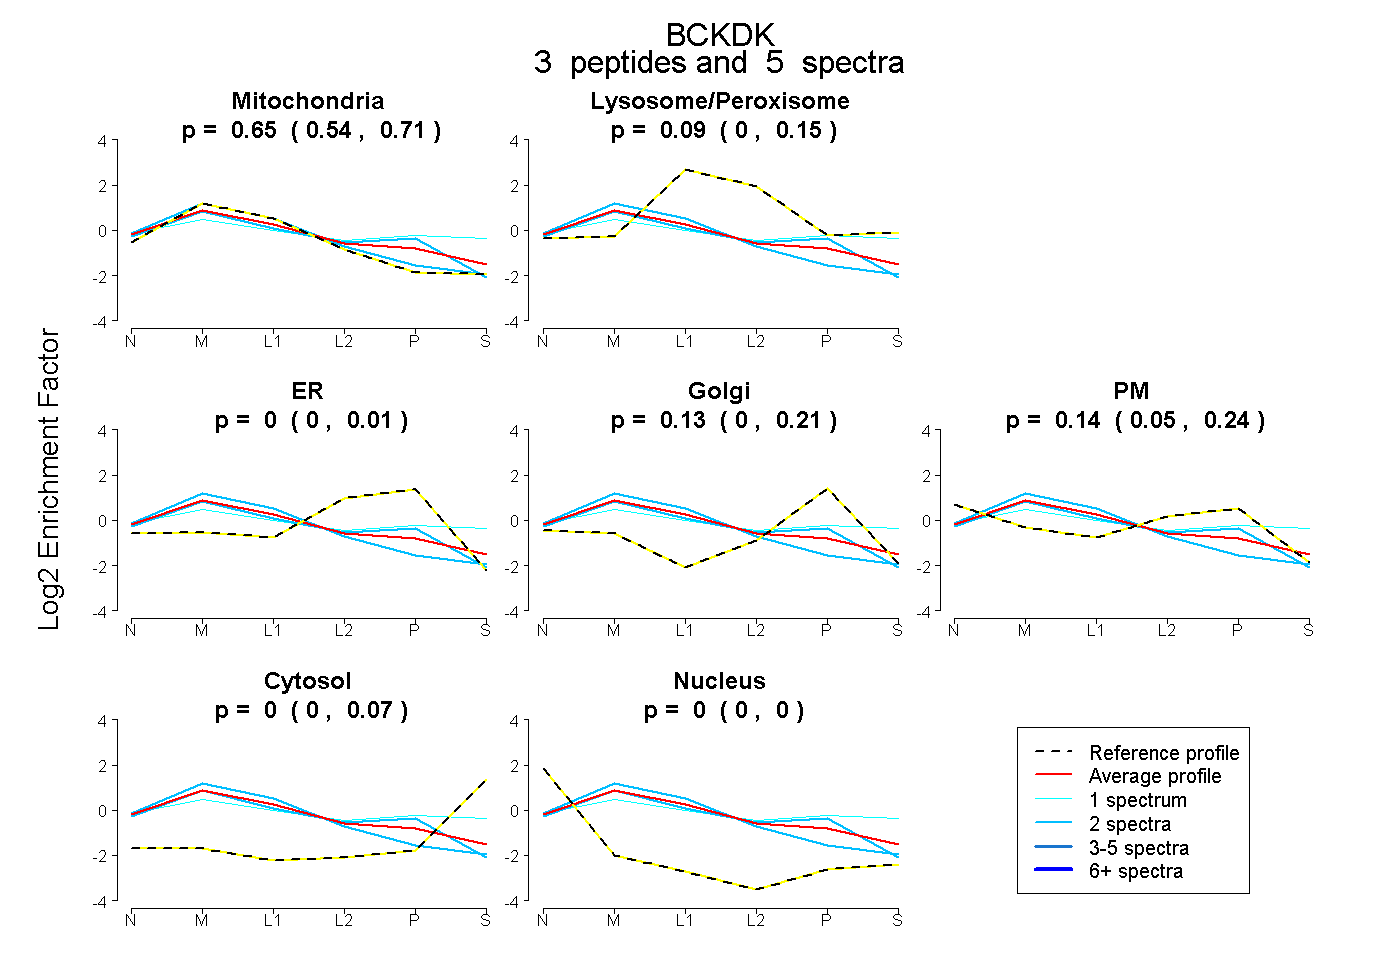
0.544 | 0.712
0.000 | 0.148
0.000 | 0.010
0.000 | 0.206
0.052 | 0.238
0.000 | 0.073
0.000 | 0.000
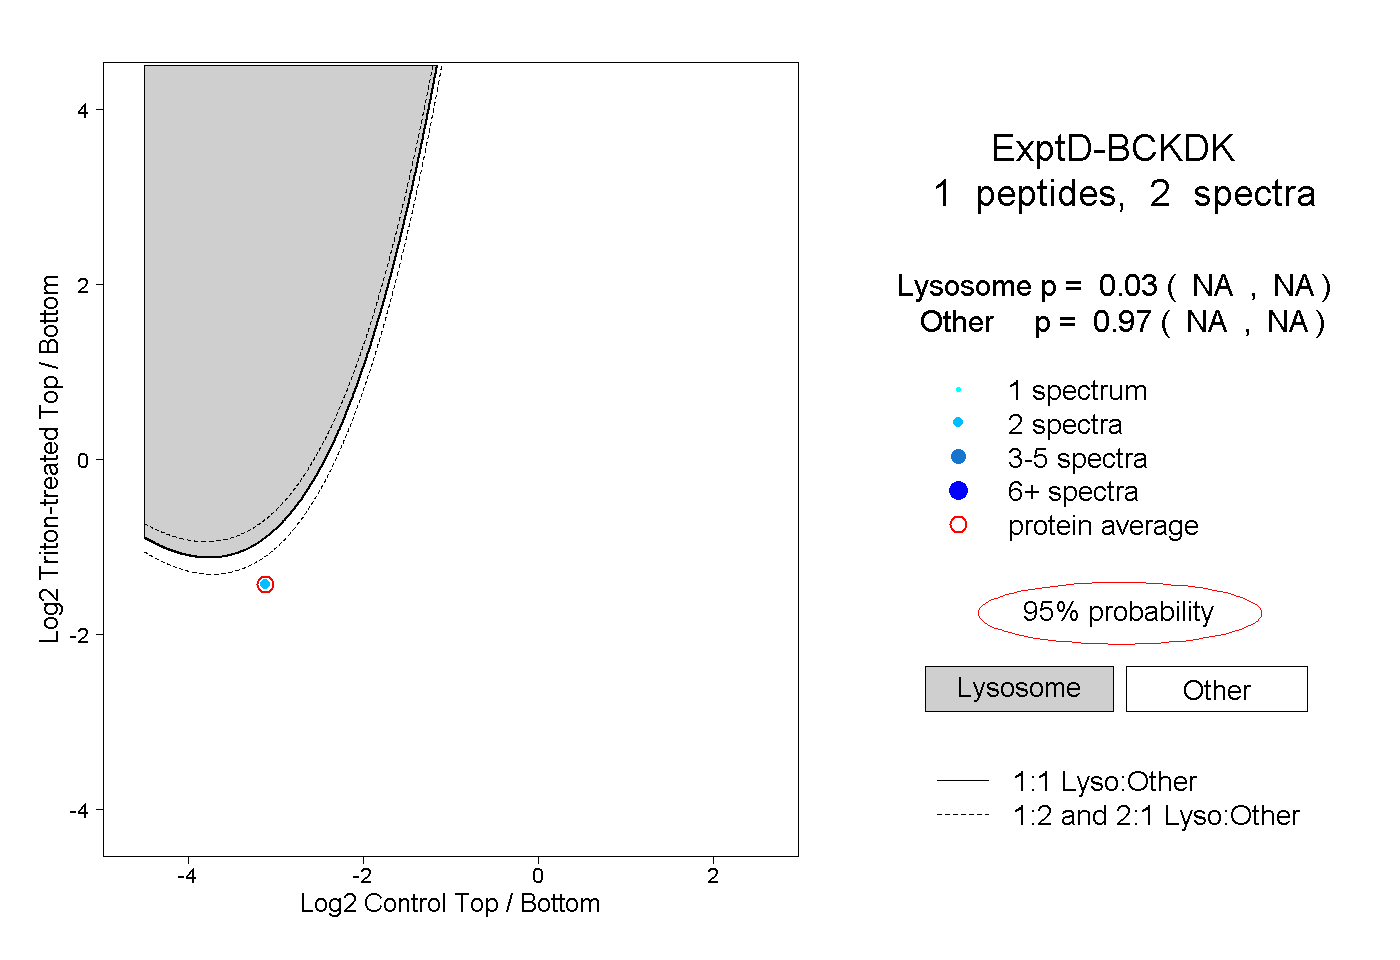
11peptides
spectra
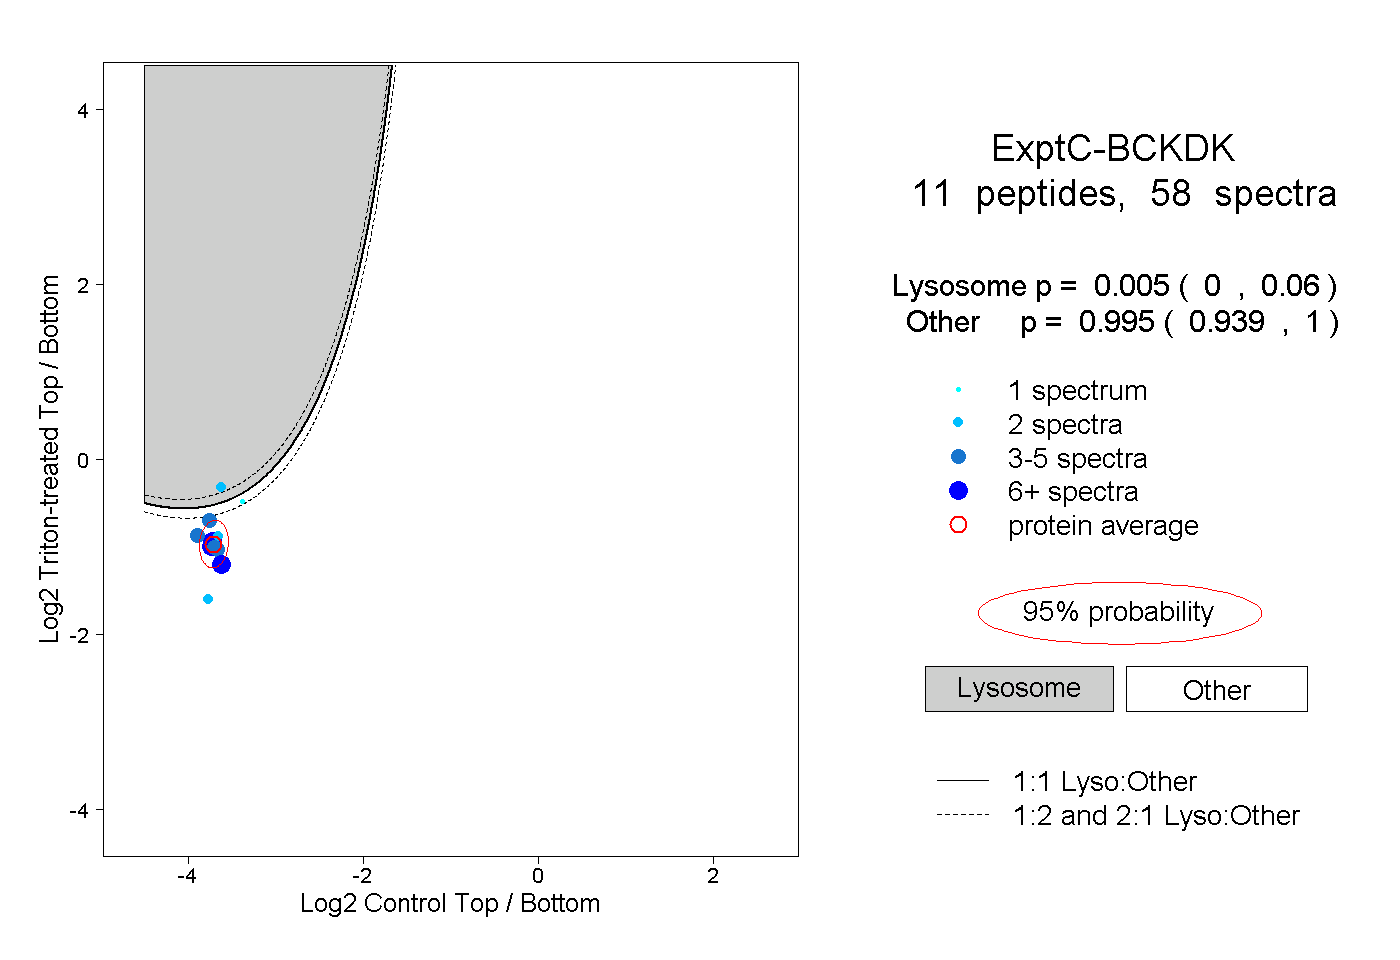
0.000 | 0.060
0.939 | 1.000