 4
4peptides
spectra
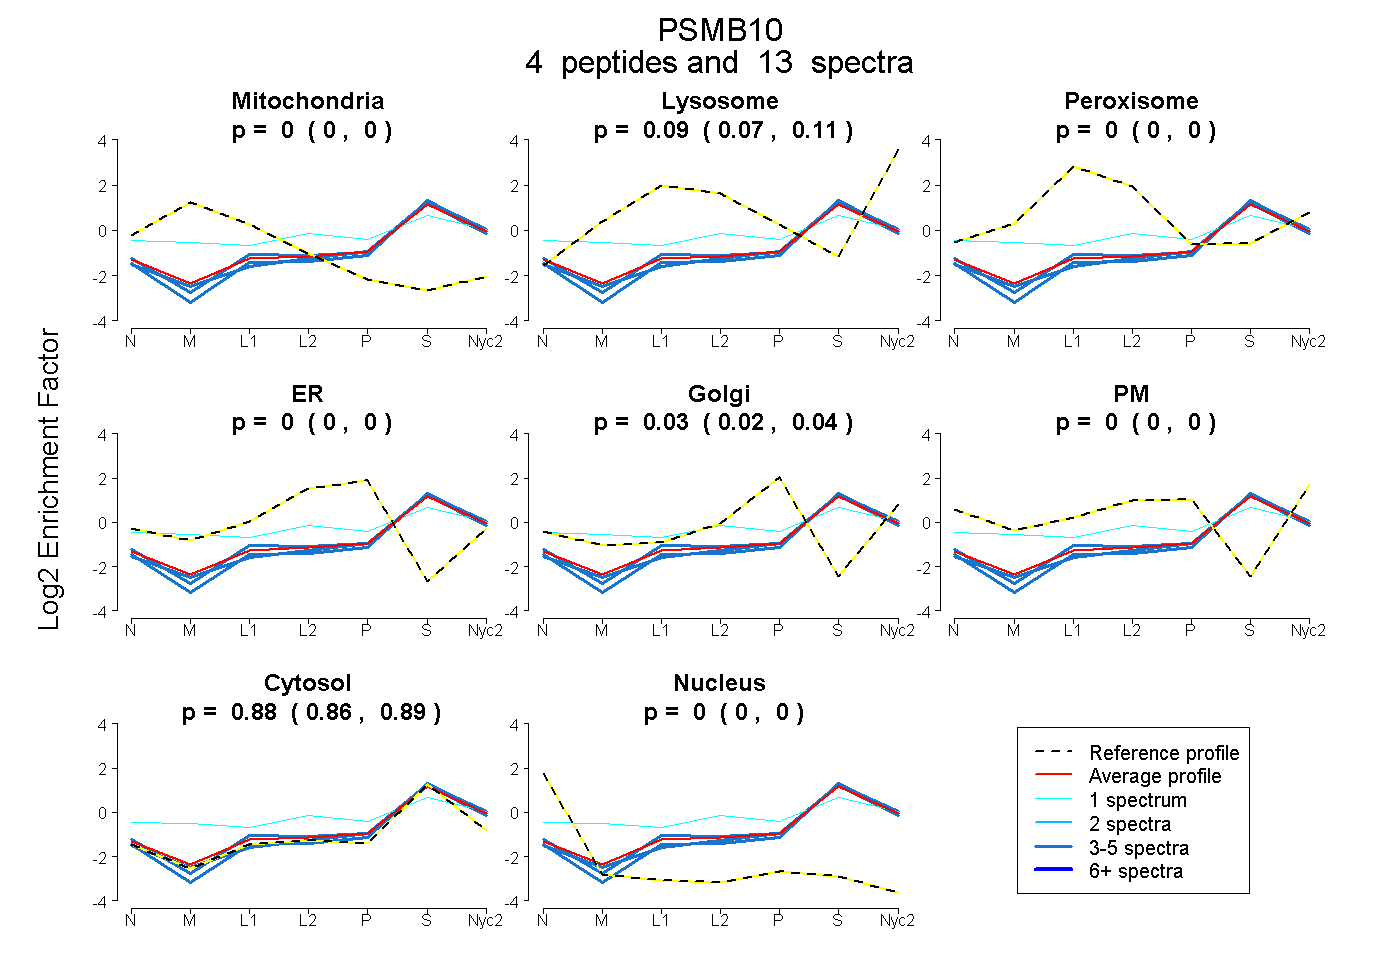
0.000 | 0.000
0.070 | 0.105
0.000 | 0.000
0.000 | 0.000
0.017 | 0.045
0.000 | 0.000
0.863 | 0.892
0.000 | 0.000
4peptides
spectra
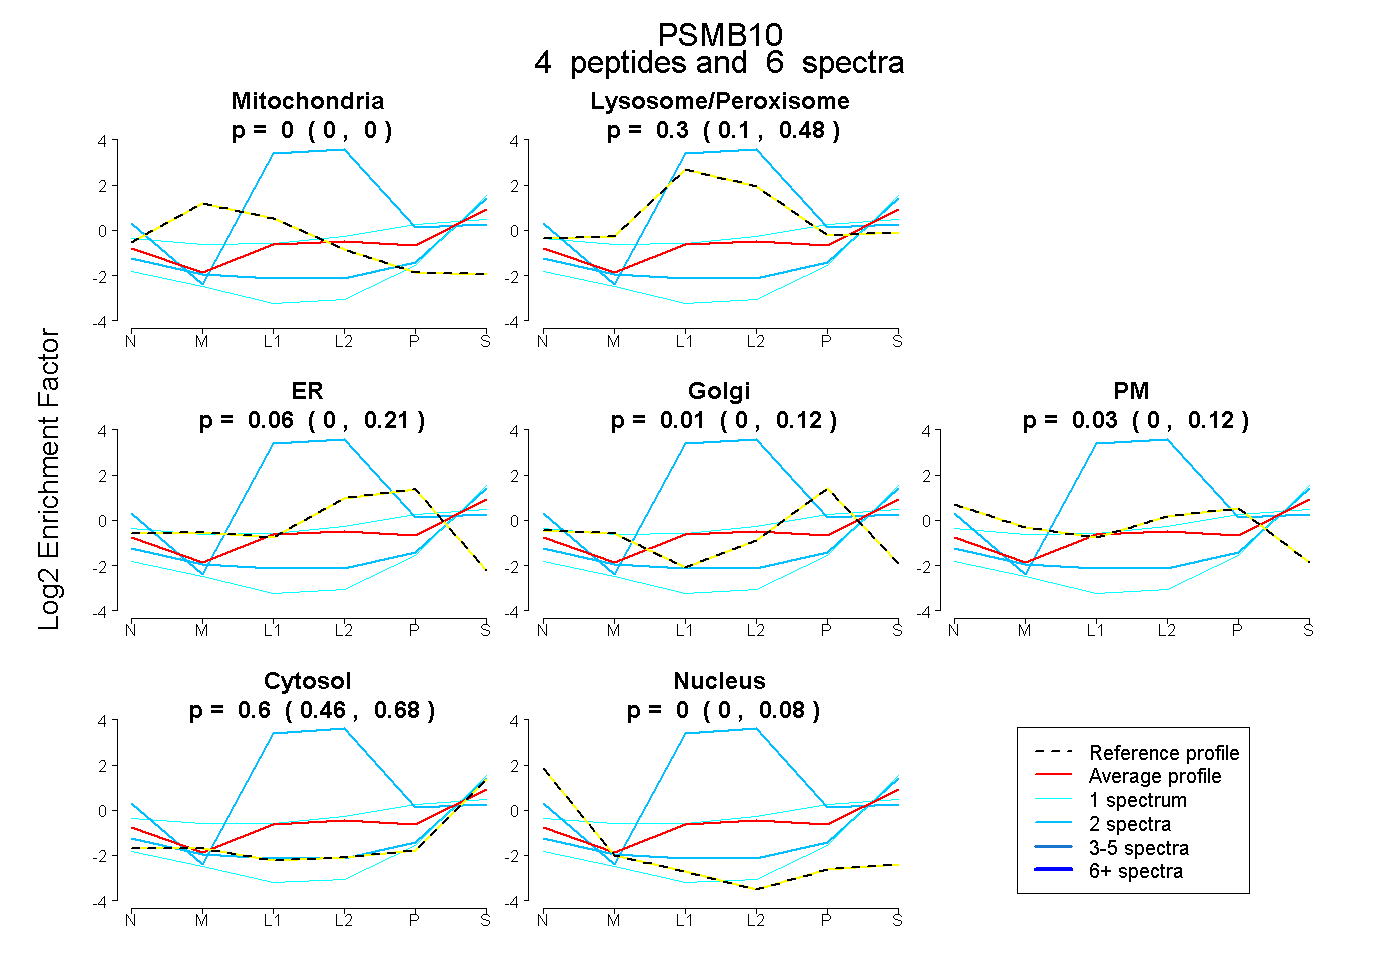
0.000 | 0.000
0.098 | 0.477
0.000 | 0.208
0.000 | 0.123
0.000 | 0.118
0.465 | 0.678
0.000 | 0.076
6peptides
spectra
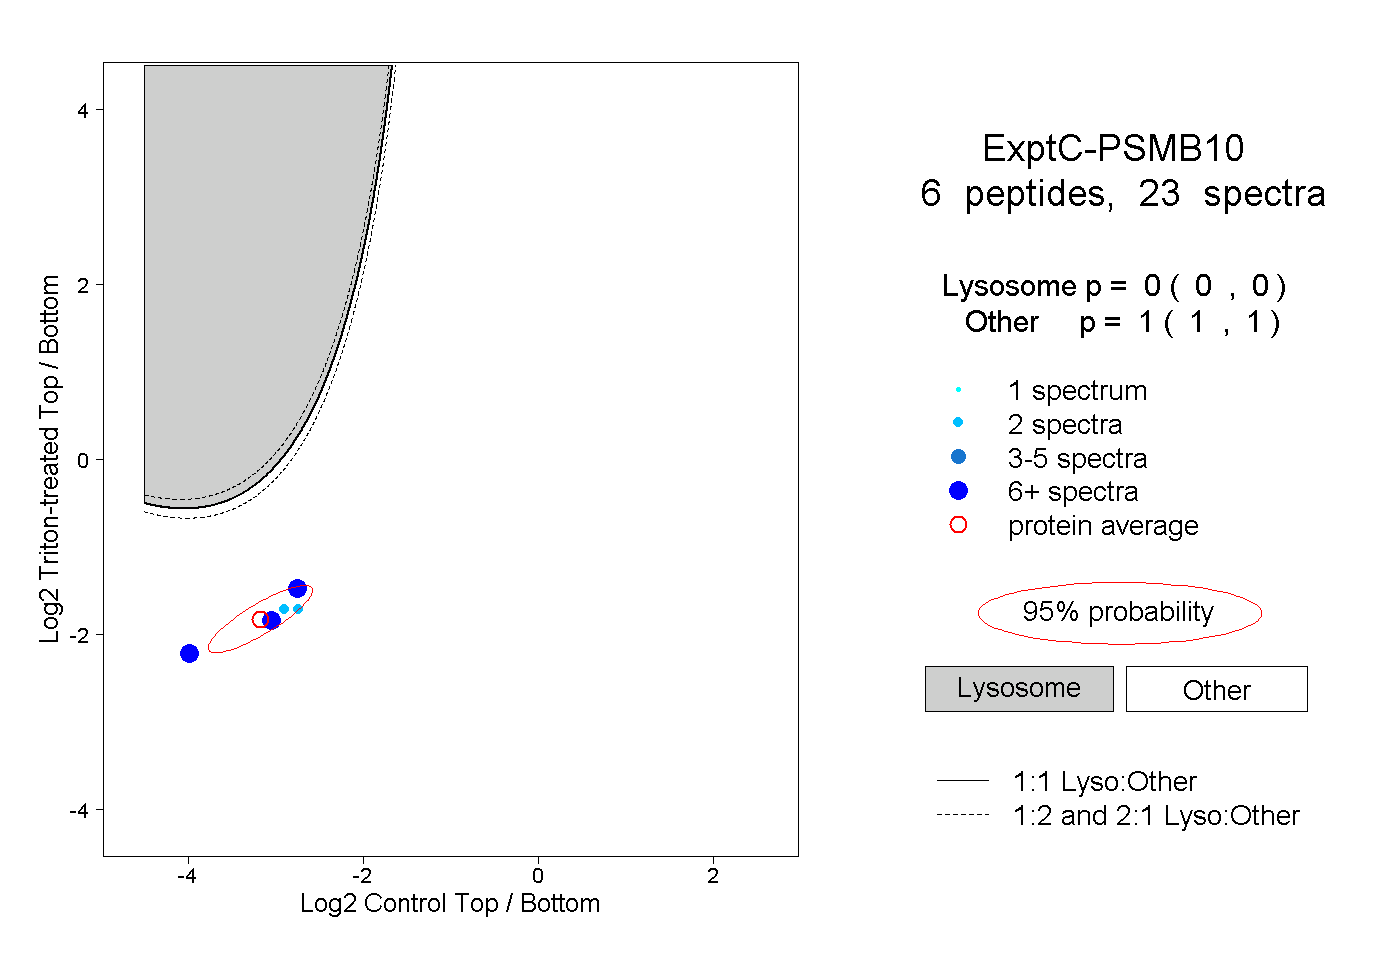
0.000 | 0.000
1.000 | 1.000
4peptides
spectra
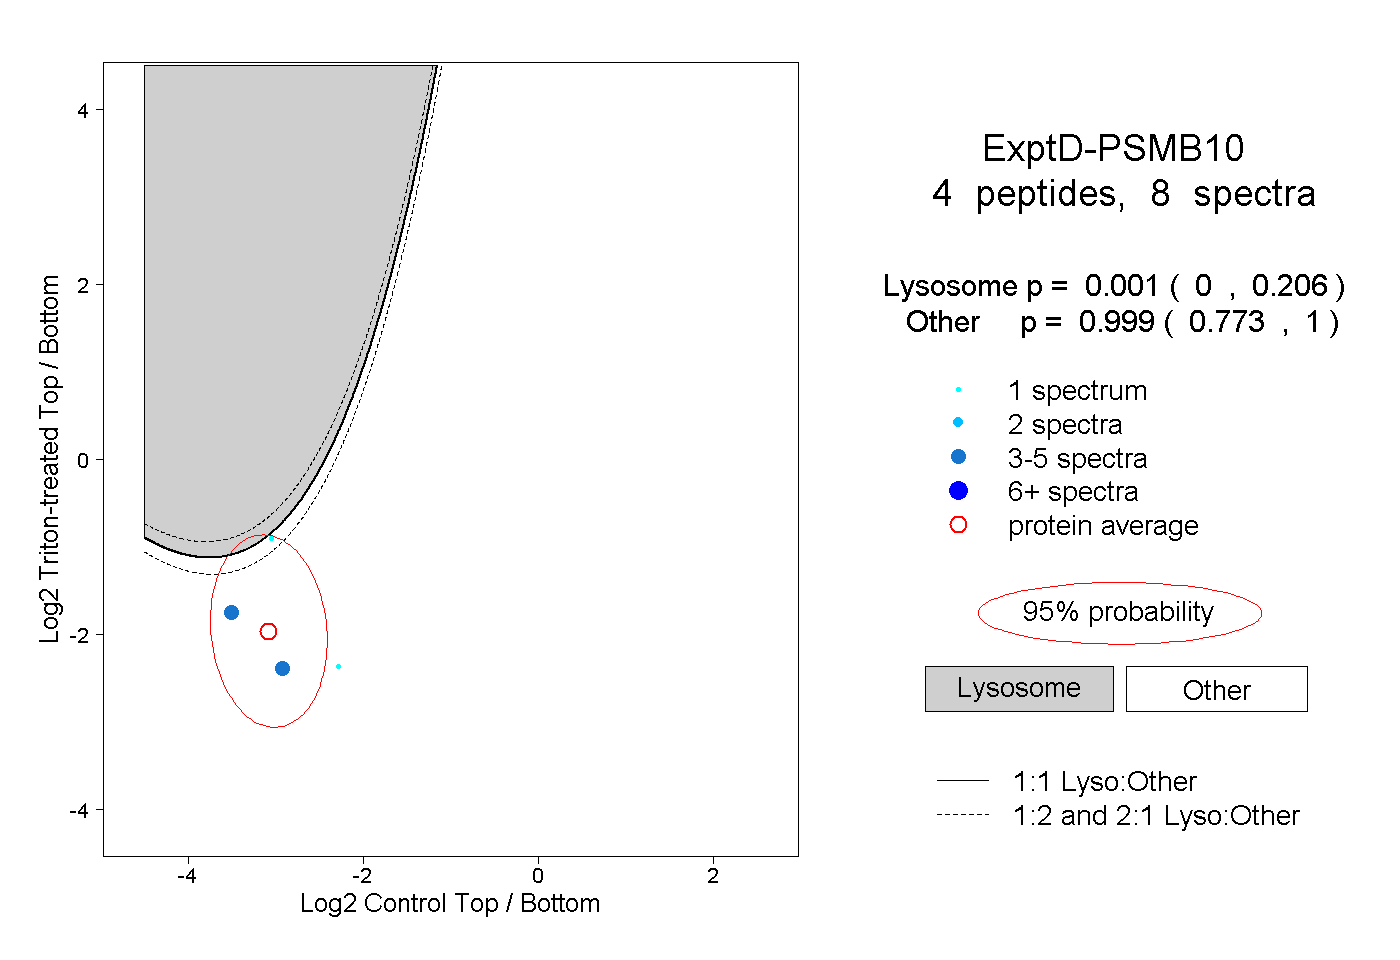
0.000 | 0.206
0.773 | 1.000