 10
10peptides
spectra
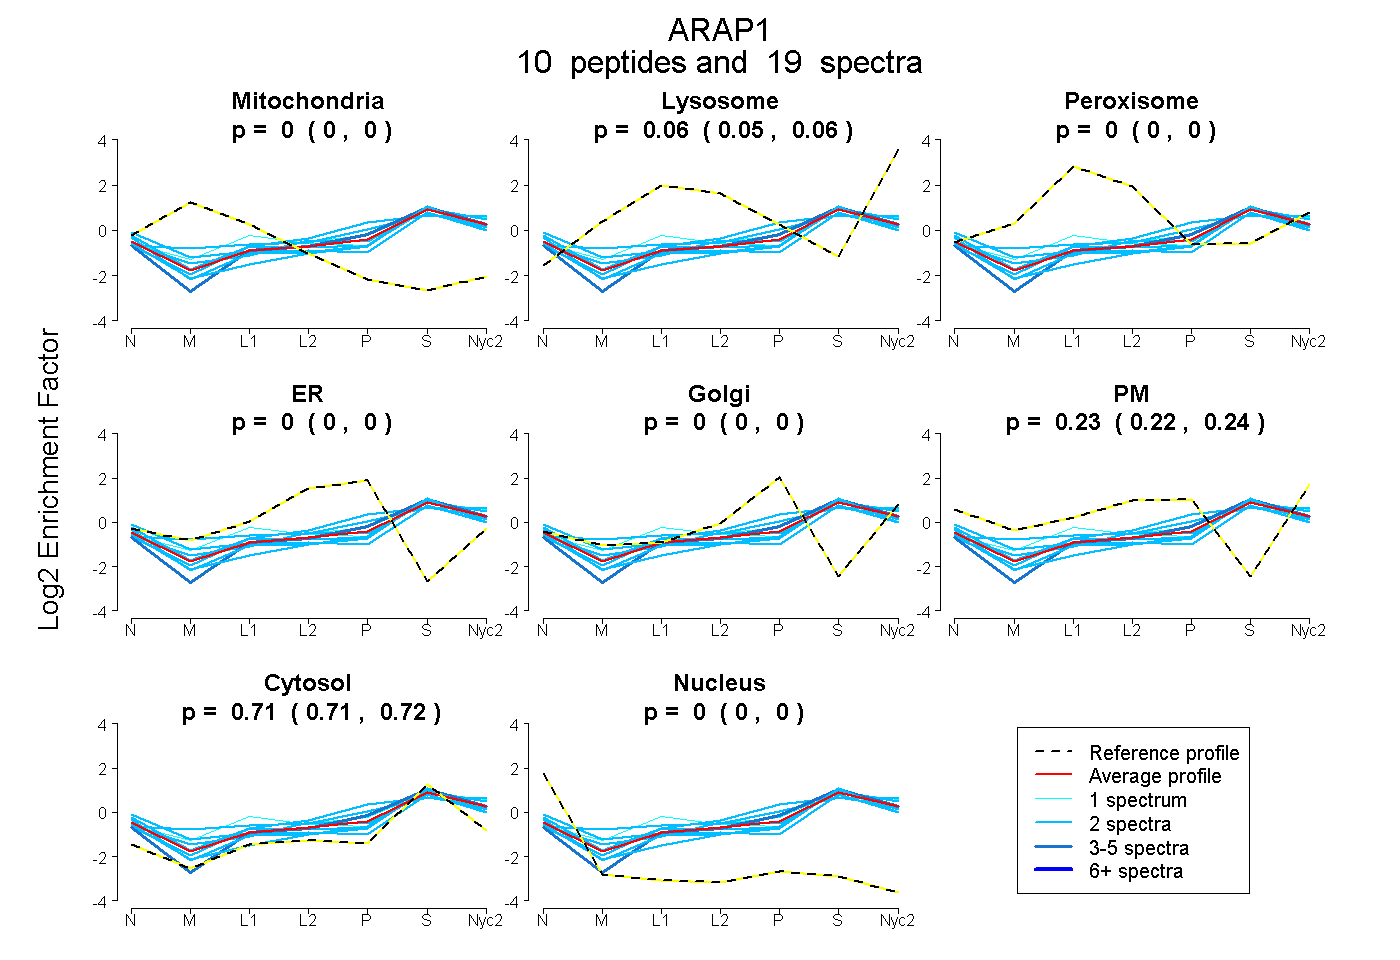
0.000 | 0.000
0.046 | 0.064
0.000 | 0.000
0.000 | 0.000
0.000 | 0.000
0.221 | 0.239
0.706 | 0.719
0.000 | 0.000
2peptides
spectra
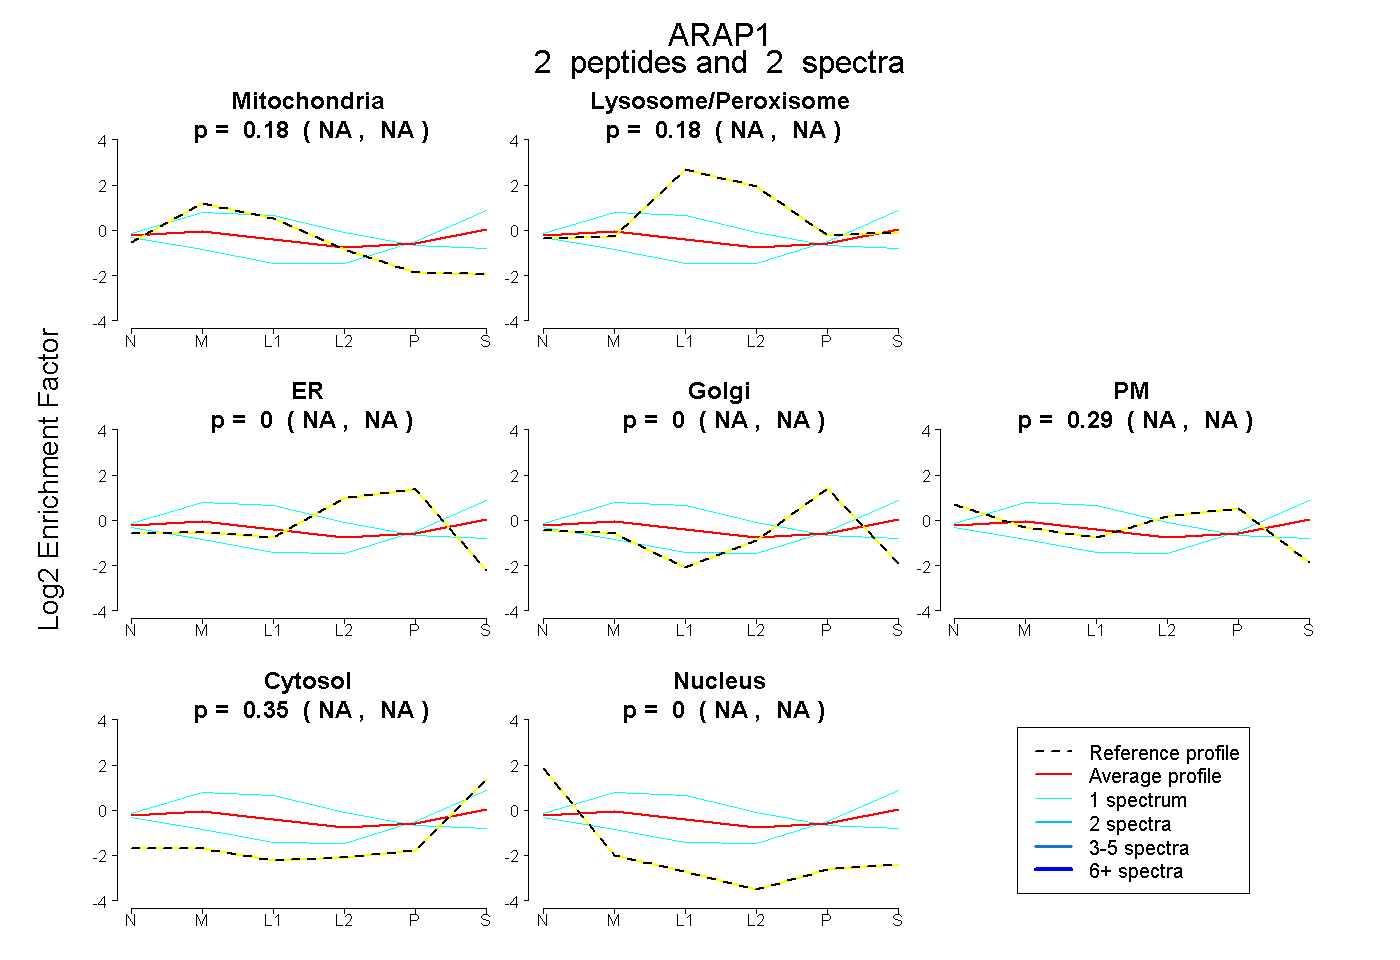
NA | NA
NA | NA
NA | NA
NA | NA
NA | NA
NA | NA
NA | NA
15peptides
spectra
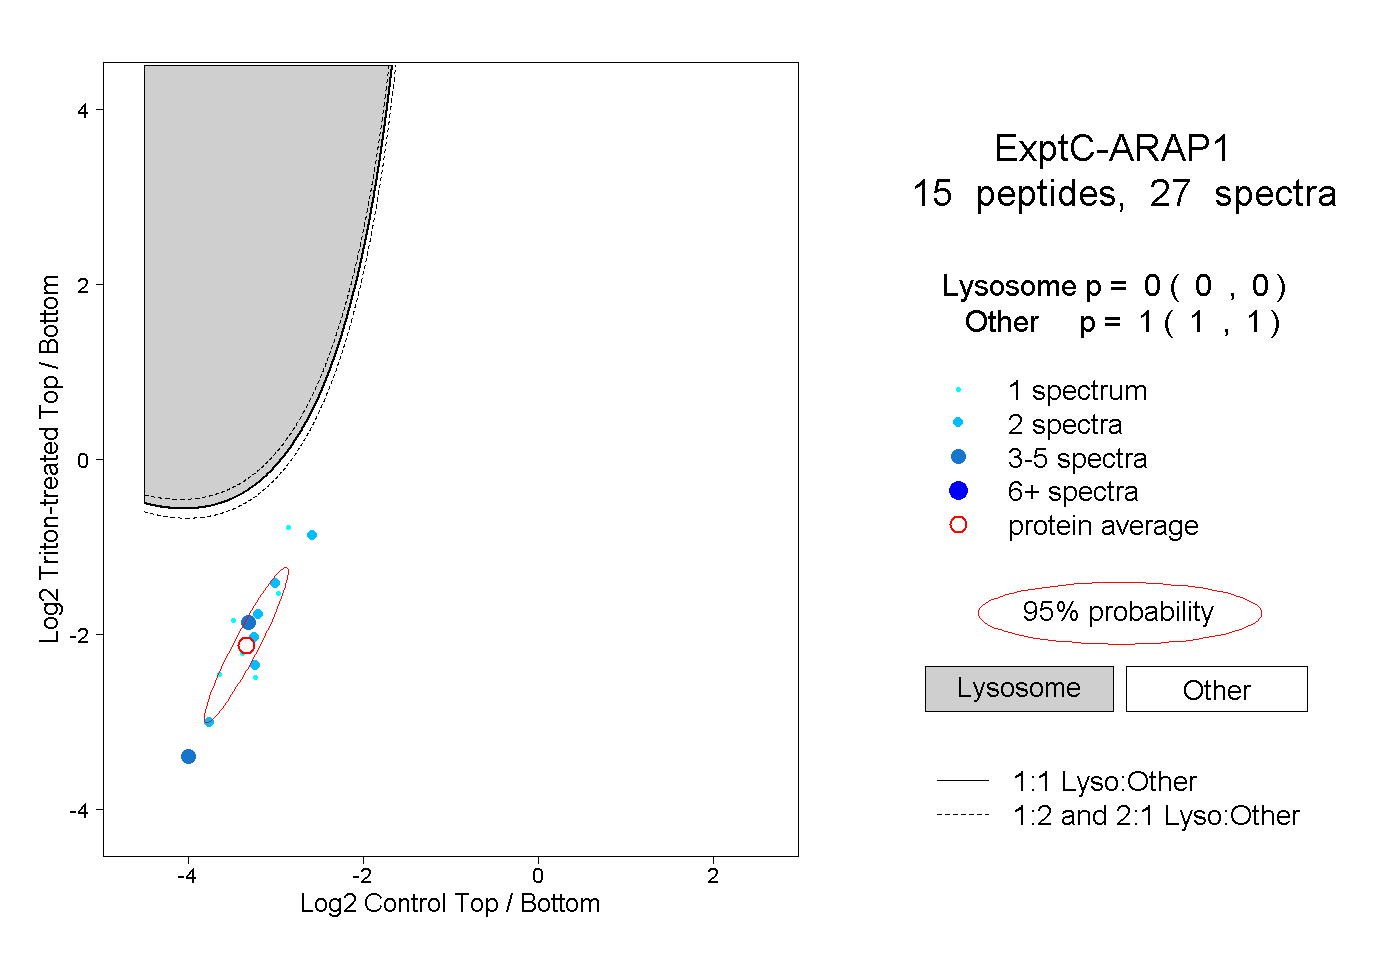
0.000 | 0.000
1.000 | 1.000
2peptides
spectra
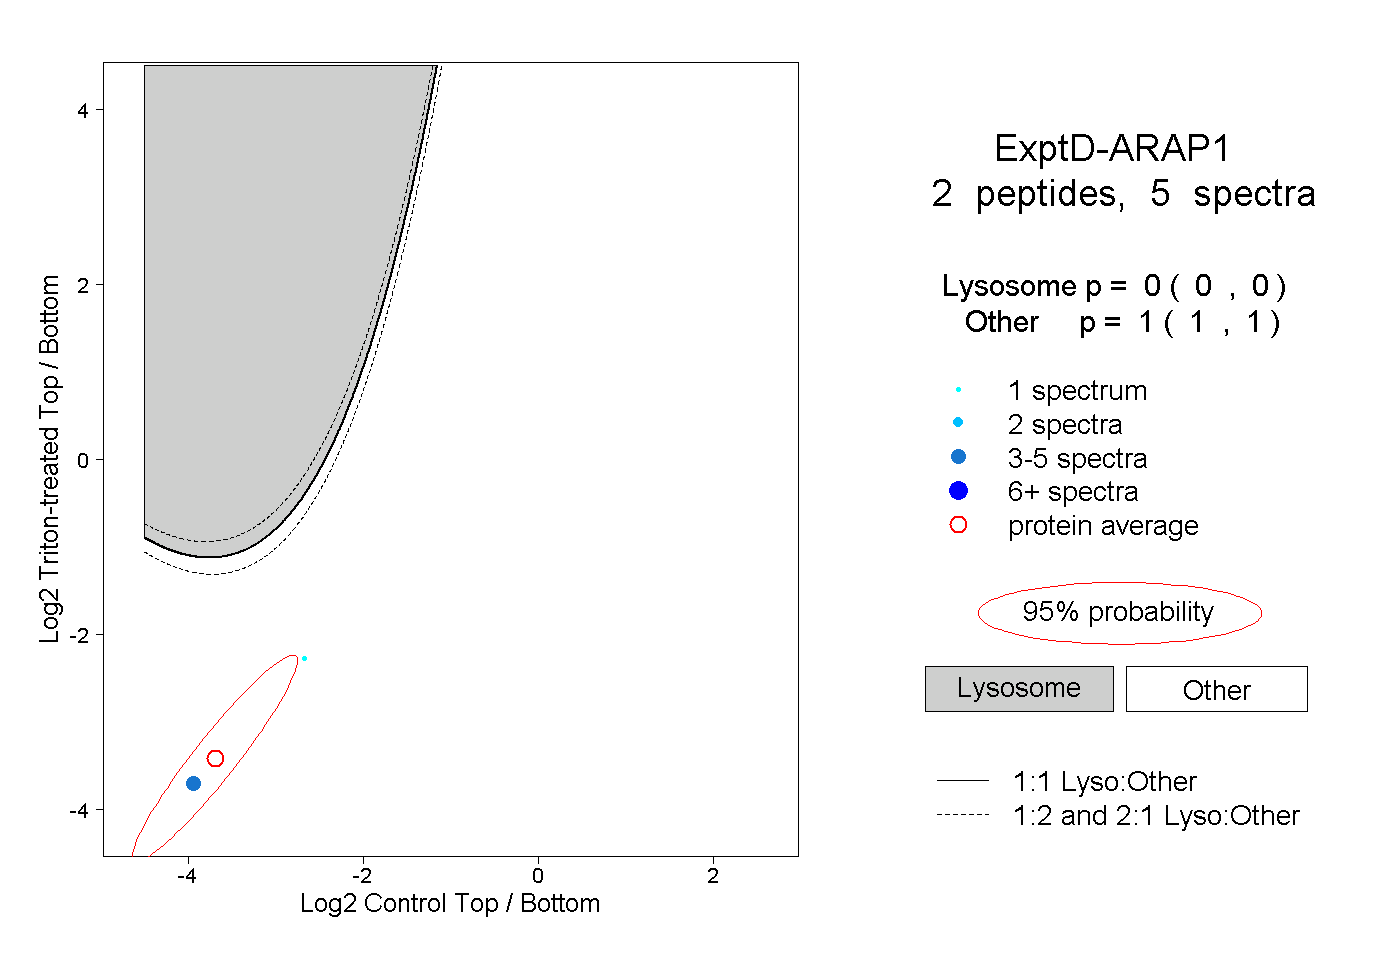
0.000 | 0.000
1.000 | 1.000