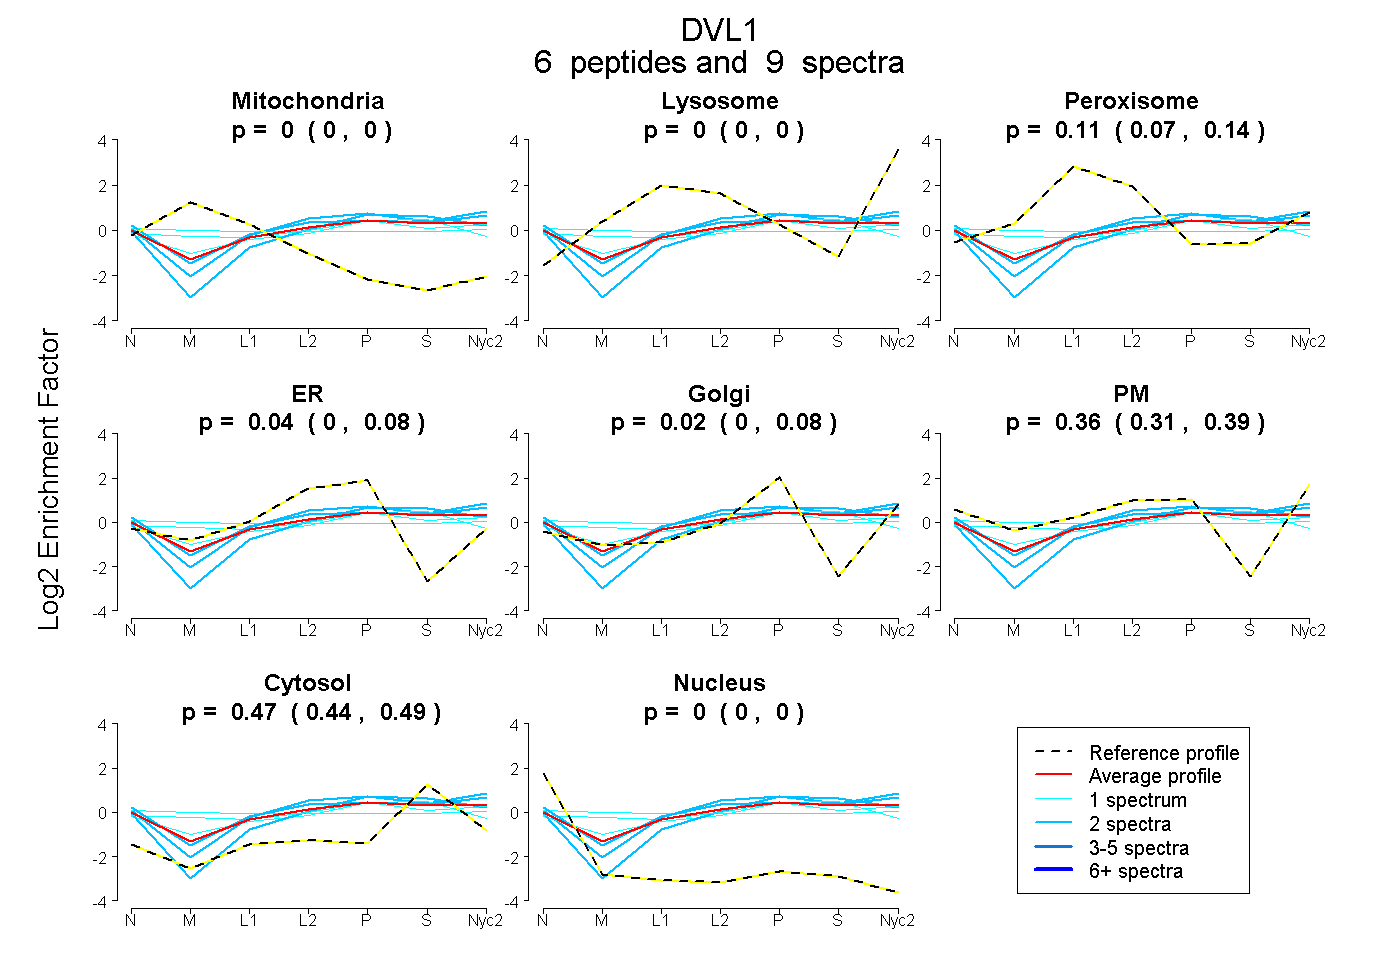
 6
6peptides
spectra
0.000 | 0.000
0.000 | 0.000
0.073 | 0.141
0.000 | 0.084
0.000 | 0.083
0.307 | 0.394
0.442 | 0.491
0.000 | 0.000
| Plot | Mito | Lyso | Perox | ER | Golgi | PM | Cytosol | Nucleus | |||||
| Expt A |
6 peptides |
9 spectra |
|
0.000 0.000 | 0.000 |
0.000 0.000 | 0.000 |
0.106 0.073 | 0.141 |
0.039 0.000 | 0.084 |
0.022 0.000 | 0.083 |
0.361 0.307 | 0.394 |
0.472 0.442 | 0.491 |
0.000 0.000 | 0.000 |
| 2 spectra, VTLADFK | 0.000 | 0.000 | 0.119 | 0.000 | 0.000 | 0.444 | 0.437 | 0.000 | ||
| 1 spectrum, GDGGIYIGSIMK | 0.000 | 0.000 | 0.183 | 0.094 | 0.189 | 0.048 | 0.486 | 0.000 | ||
| 2 spectra, EEIFDDNAK | 0.000 | 0.057 | 0.030 | 0.035 | 0.000 | 0.424 | 0.454 | 0.000 | ||
| 1 spectrum, SYFTIPR | 0.015 | 0.000 | 0.220 | 0.000 | 0.202 | 0.201 | 0.362 | 0.000 | ||
| 1 spectrum, GGAVAADGR | 0.122 | 0.000 | 0.196 | 0.000 | 0.000 | 0.330 | 0.353 | 0.000 | ||
| 2 spectra, LSSSTEQSTSSR | 0.000 | 0.000 | 0.000 | 0.102 | 0.122 | 0.181 | 0.594 | 0.000 |
| Plot | Lyso | Other | |||||||||||
| Expt C |
5 peptides |
5 spectra |
 |
0.000 0.000 | 0.000 |
1.000 1.000 | 1.000 |