11
11peptides
spectra
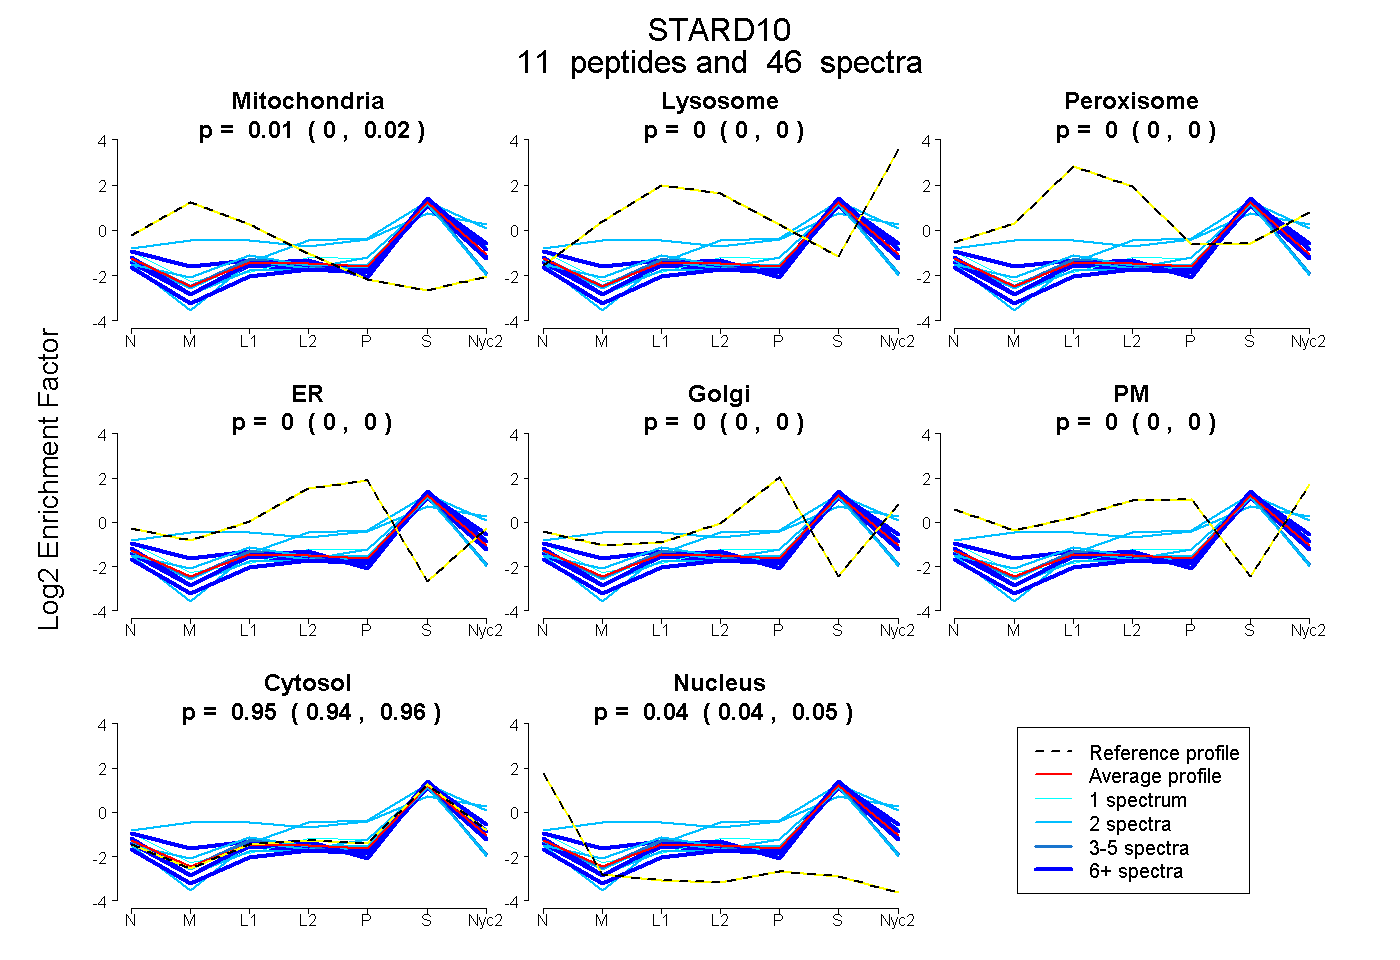
0.000 | 0.016
0.000 | 0.000
0.000 | 0.000
0.000 | 0.000
0.000 | 0.000
0.000 | 0.000
0.943 | 0.956
0.036 | 0.048
5peptides
spectra
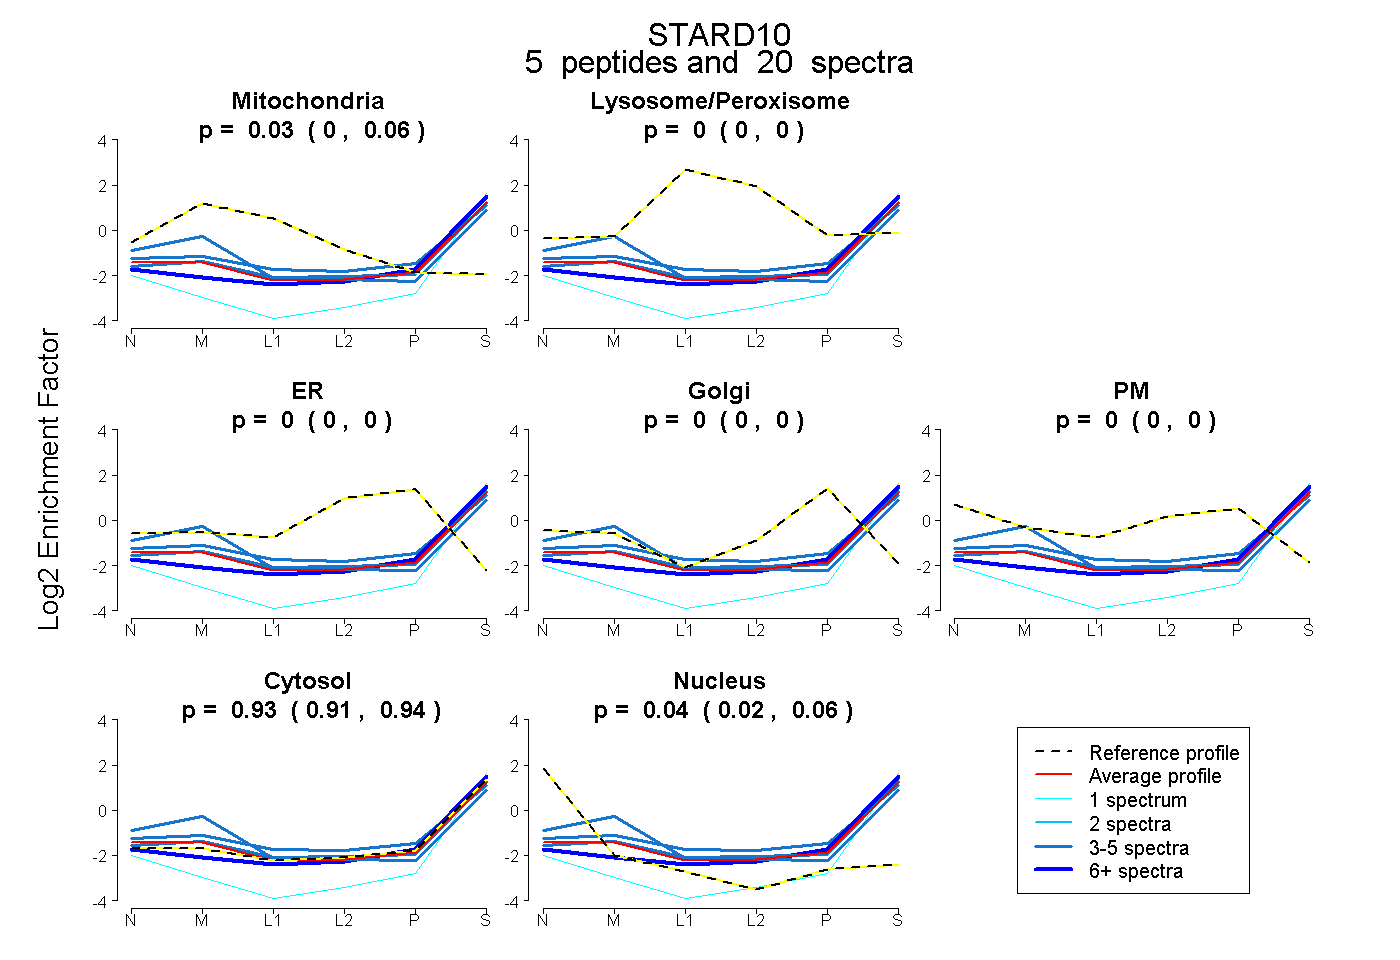
0.004 | 0.057
0.000 | 0.000
0.000 | 0.000
0.000 | 0.000
0.000 | 0.000
0.910 | 0.942
0.019 | 0.056