 11
11peptides
spectra
0.000 | 0.016
0.000 | 0.000
0.000 | 0.000
0.000 | 0.000
0.000 | 0.000
0.000 | 0.000
0.943 | 0.956
0.036 | 0.048
| Plot | Mito | Lyso | Perox | ER | Golgi | PM | Cytosol | Nucleus | |||||
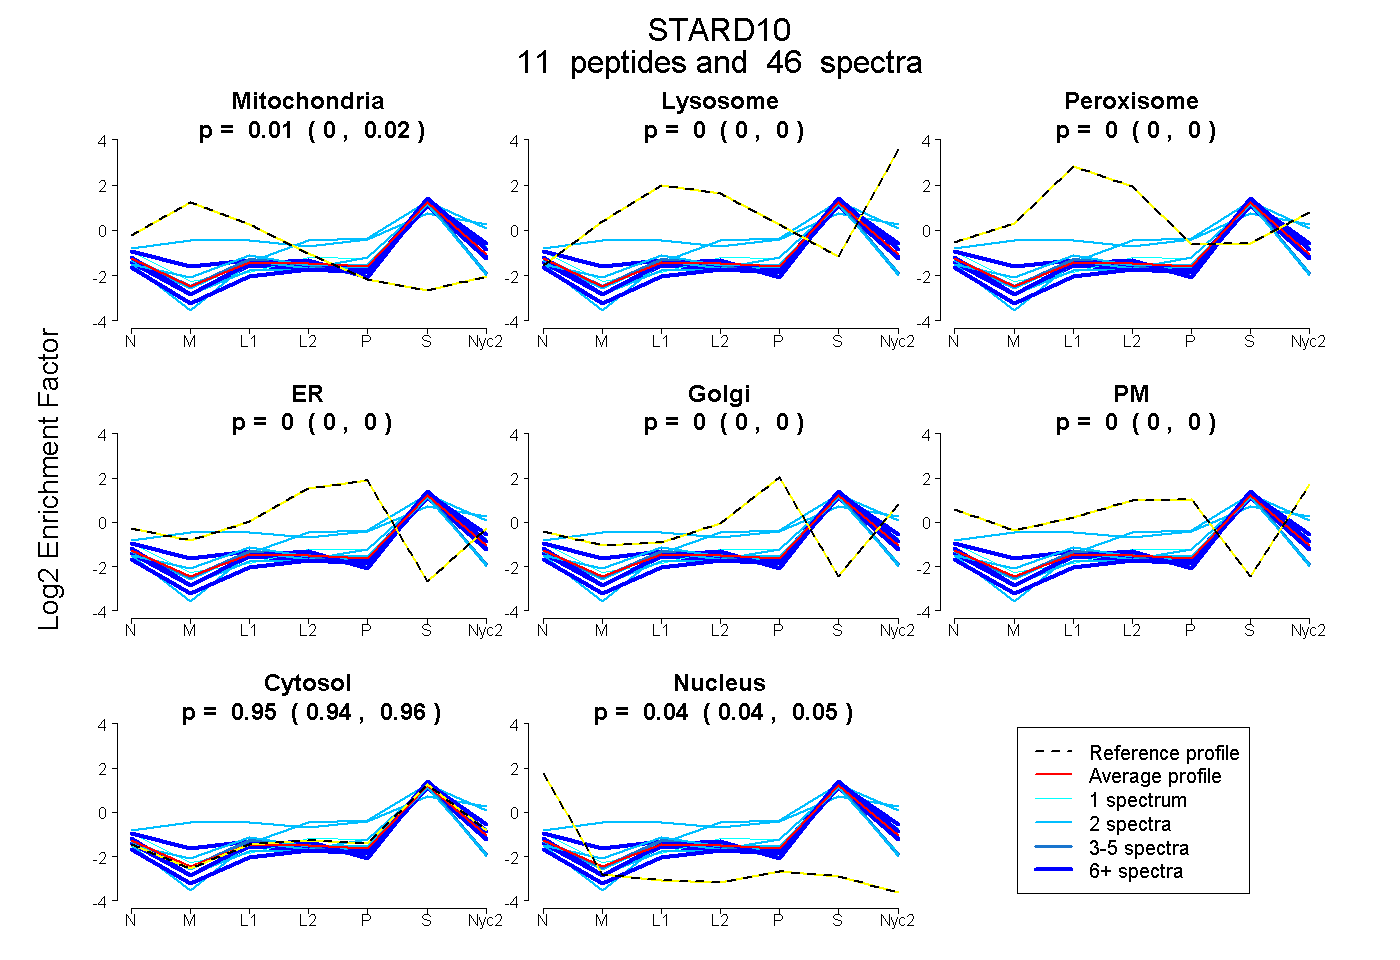
| Expt A |
11 peptides |
46 spectra |
|
0.007 0.000 | 0.016 |
0.000 0.000 | 0.000 |
0.000 0.000 | 0.000 |
0.000 0.000 | 0.000 |
0.000 0.000 | 0.000 |
0.000 0.000 | 0.000 |
0.950 0.943 | 0.956 |
0.043 0.036 | 0.048 |
| 1 spectrum, CPKPLK | 0.000 | 0.000 | 0.000 | 0.002 | 0.000 | 0.000 | 0.888 | 0.110 | ||
| 2 spectra, LTVNADVGYYSWR | 0.000 | 0.042 | 0.000 | 0.000 | 0.093 | 0.000 | 0.865 | 0.000 | ||
| 12 spectra, ESVQVPDDQDFR | 0.137 | 0.000 | 0.000 | 0.000 | 0.000 | 0.000 | 0.831 | 0.032 | ||
| 6 spectra, WDSNVIETFDIAR | 0.000 | 0.000 | 0.000 | 0.000 | 0.000 | 0.000 | 0.967 | 0.033 | ||
| 2 spectra, SCVITYLAQVDPK | 0.000 | 0.000 | 0.000 | 0.000 | 0.000 | 0.000 | 0.903 | 0.097 | ||
| 2 spectra, DVITLR | 0.000 | 0.000 | 0.000 | 0.000 | 0.000 | 0.000 | 0.953 | 0.047 | ||
| 7 spectra, AGVSVWVQAVEMDR | 0.000 | 0.000 | 0.000 | 0.000 | 0.000 | 0.000 | 0.953 | 0.047 | ||
| 2 spectra, SWLPMGADYIIMNYSVK | 0.096 | 0.000 | 0.000 | 0.000 | 0.000 | 0.000 | 0.872 | 0.033 | ||
| 2 spectra, AVSIQTGYLIQSTGPK | 0.100 | 0.227 | 0.035 | 0.000 | 0.056 | 0.017 | 0.566 | 0.000 | ||
| 6 spectra, SSQFLAPK | 0.000 | 0.000 | 0.000 | 0.000 | 0.000 | 0.000 | 0.978 | 0.022 | ||
| 4 spectra, SECEAEVGWNLTYSK | 0.013 | 0.000 | 0.000 | 0.000 | 0.000 | 0.000 | 0.887 | 0.100 |
| Plot | Mito | Lyso or Perox | ER | Golgi | PM | Cytosol | Nucleus | ||||||
| Expt B |
5 peptides |
20 spectra |
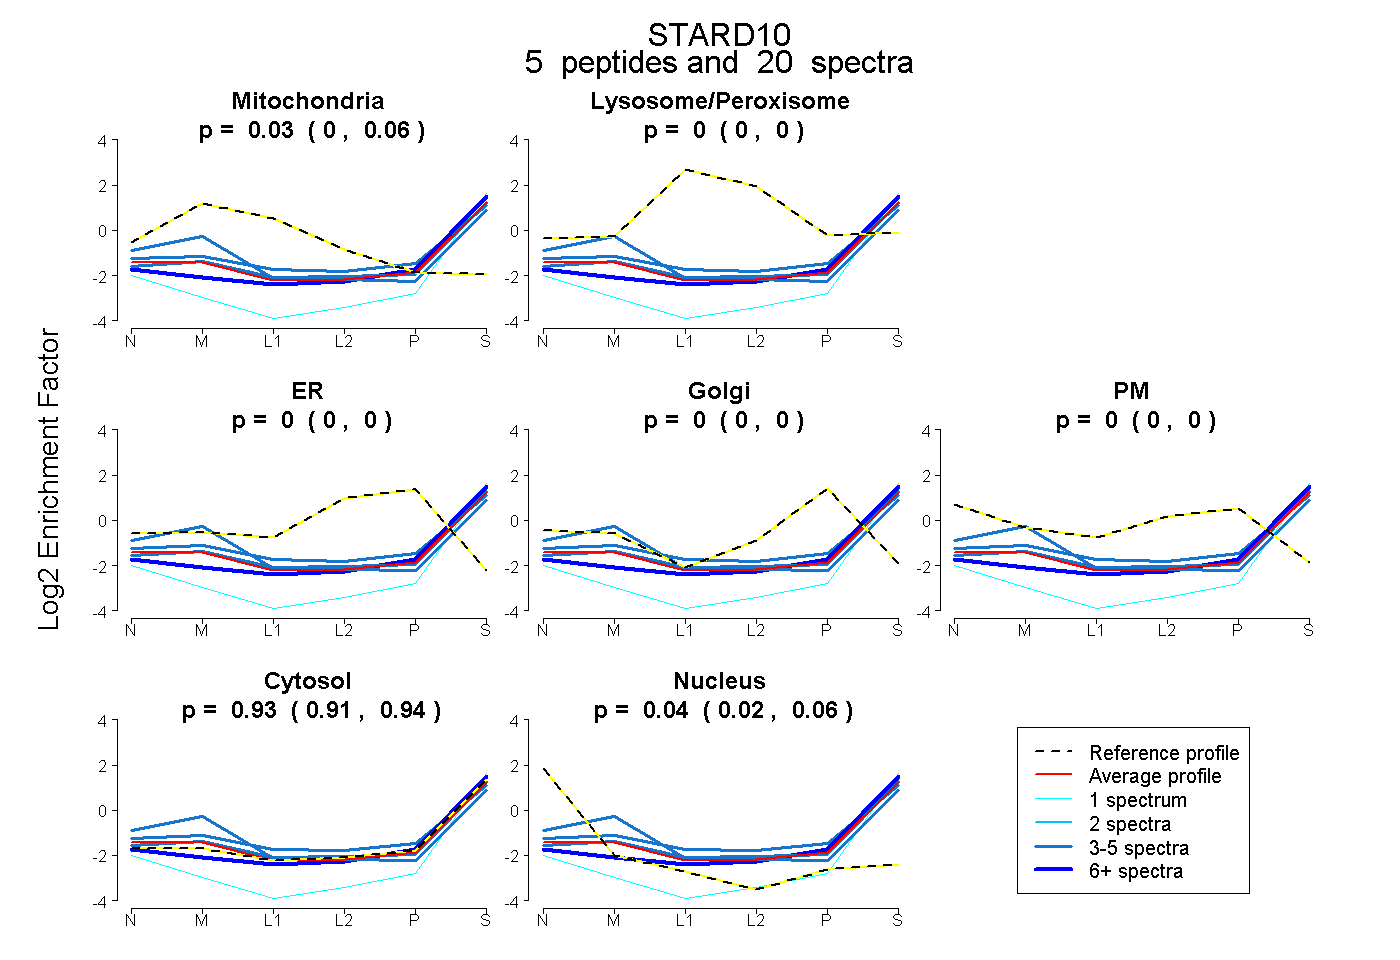 |
0.033 0.004 | 0.057 |
0.000 0.000 | 0.000 |
0.000 0.000 | 0.000 |
0.000 0.000 | 0.000 |
0.000 0.000 | 0.000 |
0.928 0.910 | 0.942 |
0.039 0.019 | 0.056 |
|||
| Plot | Lyso | Other | |||||||||||
| Expt C |
10 peptides |
70 spectra |
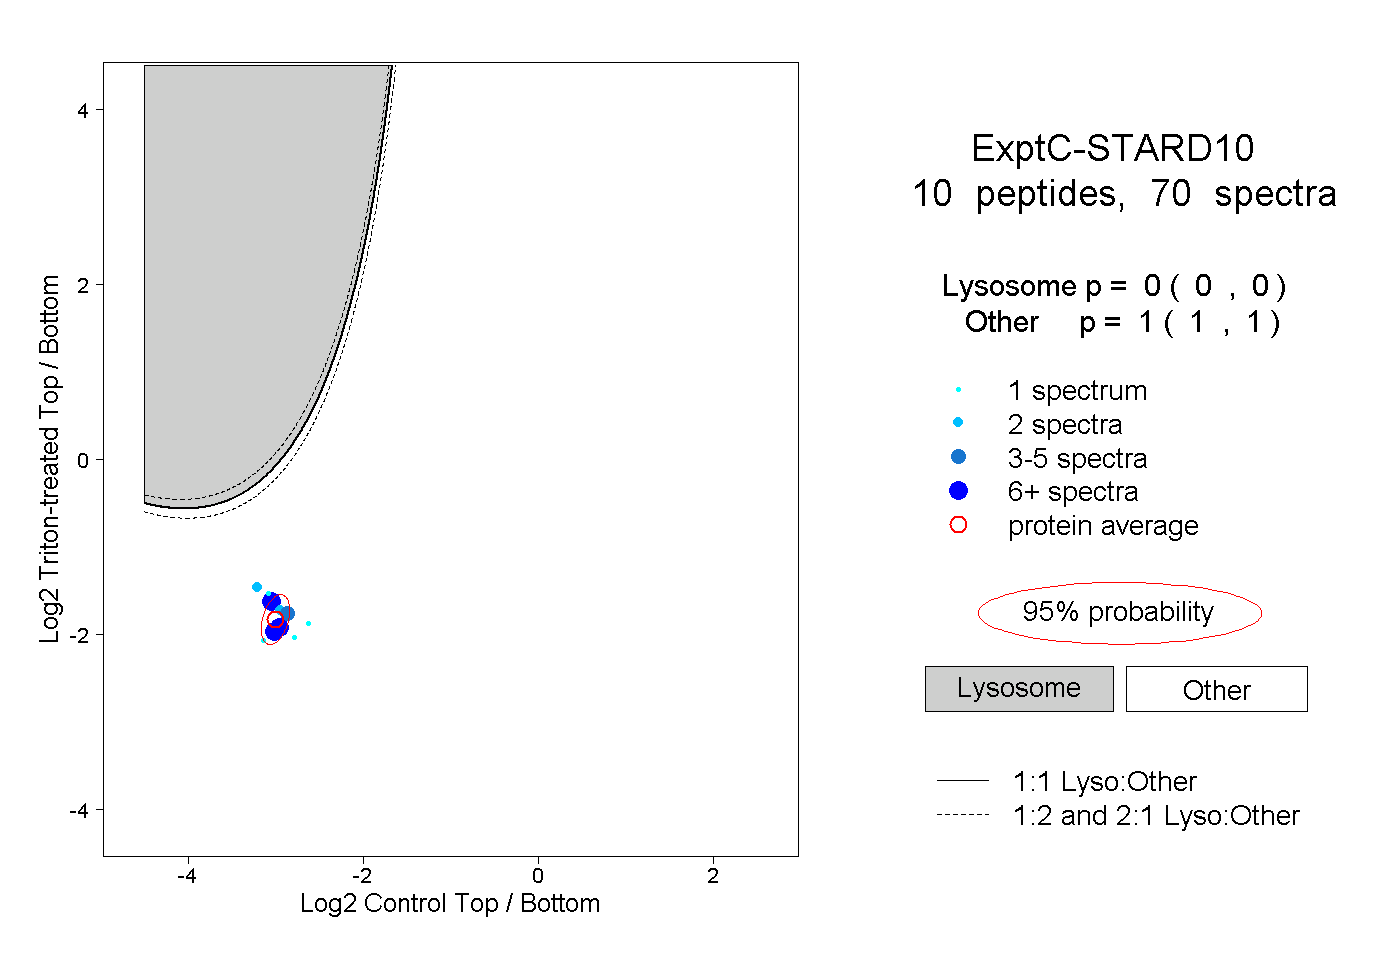 |
0.000 0.000 | 0.000 |
1.000 1.000 | 1.000 |
||||||||
| Plot | Lyso | Other | |||||||||||
| Expt D |
3 peptides |
15 spectra |
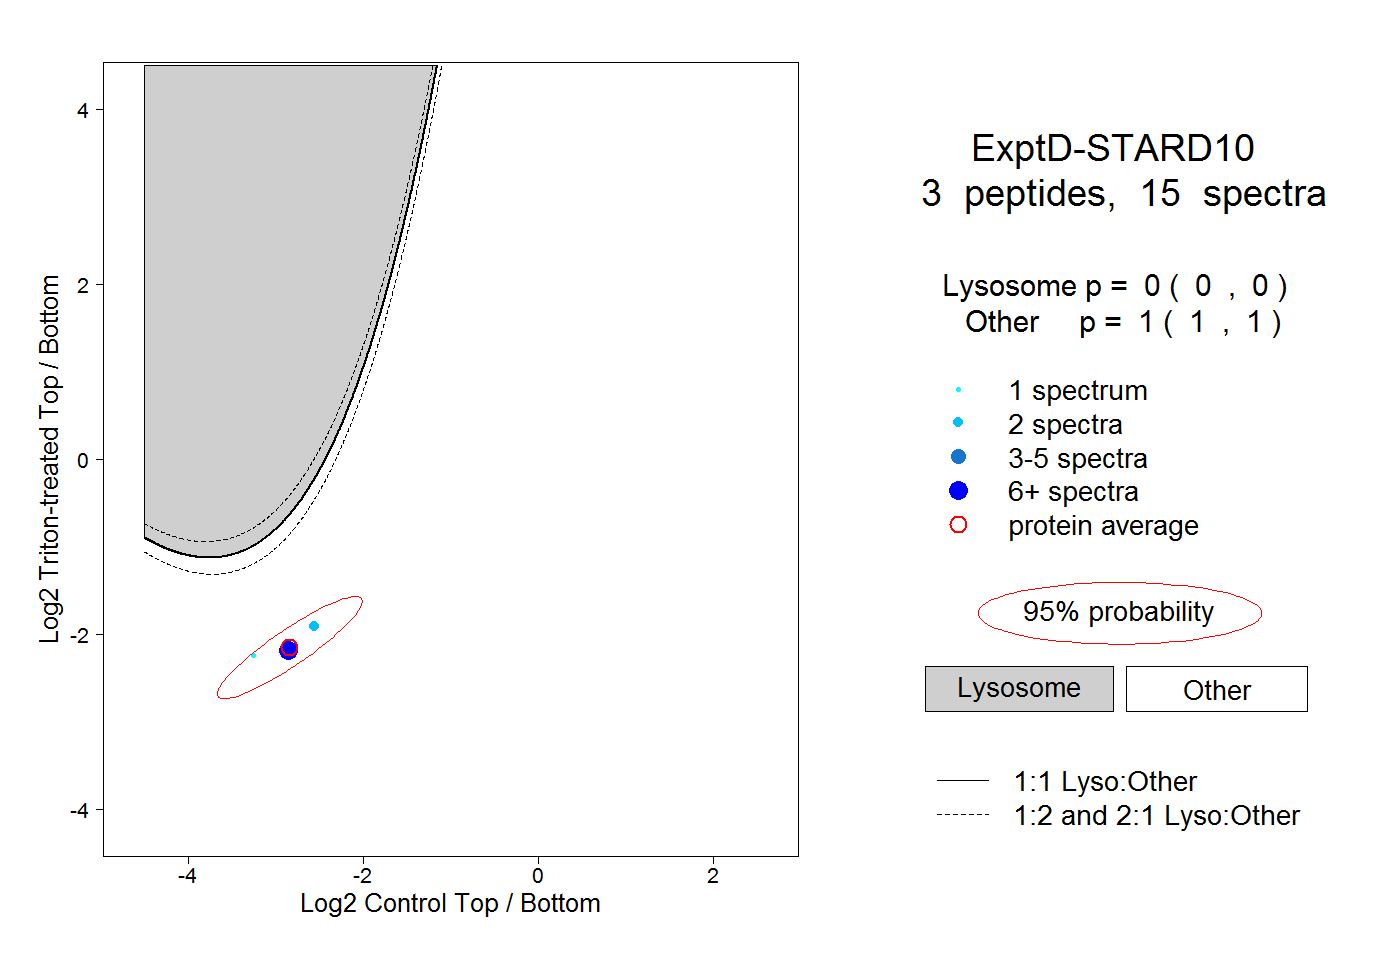 |
0.000 0.000 | 0.000 |
1.000 1.000 | 1.000 |