 26
26peptides
spectra
0.000 | 0.000
0.000 | 0.000
0.000 | 0.000
0.042 | 0.065
0.000 | 0.017
0.000 | 0.000
0.362 | 0.368
0.569 | 0.576
| Plot | Mito | Lyso | Perox | ER | Golgi | PM | Cytosol | Nucleus | |||||
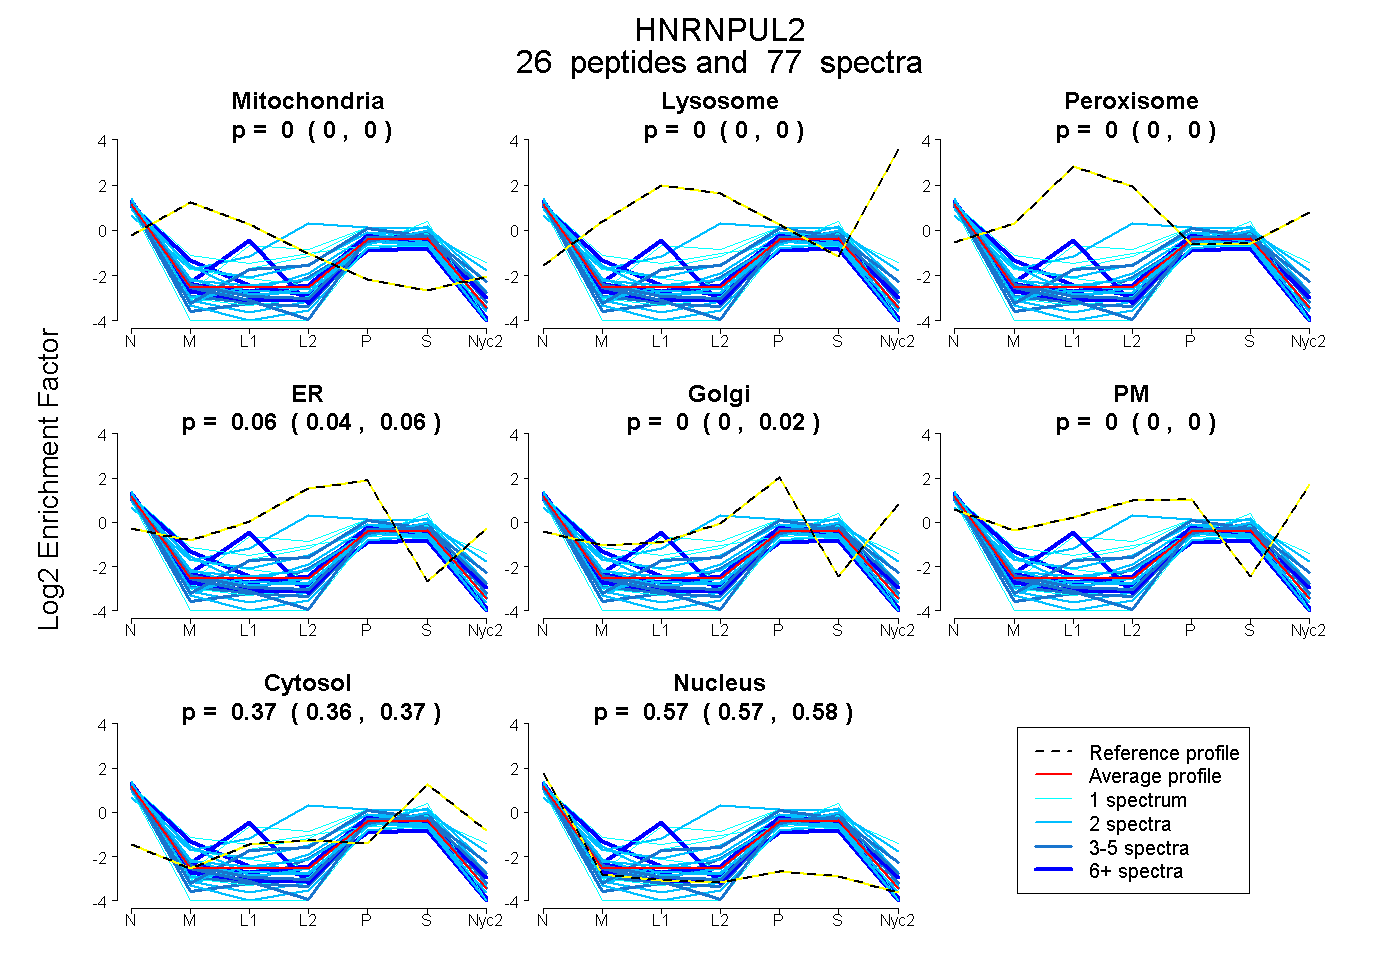
| Expt A |
26 peptides |
77 spectra |
|
0.000 0.000 | 0.000 |
0.000 0.000 | 0.000 |
0.000 0.000 | 0.000 |
0.059 0.042 | 0.065 |
0.003 0.000 | 0.017 |
0.000 0.000 | 0.000 |
0.366 0.362 | 0.368 |
0.573 0.569 | 0.576 |
| 4 spectra, STYGVTK | 0.000 | 0.000 | 0.000 | 0.000 | 0.018 | 0.000 | 0.368 | 0.614 | ||
| 2 spectra, NCVIELNFGQK | 0.000 | 0.000 | 0.000 | 0.018 | 0.000 | 0.000 | 0.311 | 0.671 | ||
| 3 spectra, VTQNLPMK | 0.000 | 0.000 | 0.000 | 0.176 | 0.032 | 0.000 | 0.407 | 0.385 | ||
| 1 spectrum, ANFSLPEK | 0.000 | 0.000 | 0.000 | 0.000 | 0.009 | 0.000 | 0.354 | 0.636 | ||
| 1 spectrum, SGDETPGSEAPGDK | 0.000 | 0.000 | 0.000 | 0.000 | 0.000 | 0.000 | 0.331 | 0.669 | ||
| 1 spectrum, DLLVQQASQCLSK | 0.000 | 0.000 | 0.018 | 0.277 | 0.000 | 0.052 | 0.423 | 0.230 | ||
| 3 spectra, YNVLGAETVLTQMR | 0.000 | 0.000 | 0.000 | 0.000 | 0.027 | 0.000 | 0.369 | 0.604 | ||
| 1 spectrum, ENPEK | 0.000 | 0.000 | 0.000 | 0.101 | 0.000 | 0.000 | 0.328 | 0.571 | ||
| 2 spectra, MDLAQR | 0.000 | 0.000 | 0.000 | 0.000 | 0.048 | 0.000 | 0.509 | 0.443 | ||
| 2 spectra, NYYGYQGYR | 0.000 | 0.000 | 0.000 | 0.126 | 0.000 | 0.000 | 0.279 | 0.595 | ||
| 1 spectrum, ESLGDR | 0.000 | 0.000 | 0.000 | 0.203 | 0.000 | 0.000 | 0.319 | 0.478 | ||
| 4 spectra, EEPFFPPPEEFVFIHAVPVEER | 0.000 | 0.000 | 0.000 | 0.000 | 0.000 | 0.000 | 0.395 | 0.605 | ||
| 8 spectra, GQGYVGGQR | 0.000 | 0.000 | 0.115 | 0.025 | 0.000 | 0.000 | 0.242 | 0.618 | ||
| 1 spectrum, NFILDQCNVYNSGQR | 0.163 | 0.000 | 0.000 | 0.197 | 0.000 | 0.000 | 0.191 | 0.448 | ||
| 10 spectra, ALLPHVLCK | 0.119 | 0.000 | 0.000 | 0.012 | 0.000 | 0.000 | 0.249 | 0.620 | ||
| 6 spectra, GLEEPEMDPK | 0.000 | 0.000 | 0.000 | 0.000 | 0.123 | 0.000 | 0.344 | 0.533 | ||
| 2 spectra, LVQIASR | 0.000 | 0.000 | 0.000 | 0.000 | 0.000 | 0.000 | 0.221 | 0.779 | ||
| 1 spectrum, EGCTEVSLLR | 0.000 | 0.000 | 0.000 | 0.000 | 0.000 | 0.000 | 0.337 | 0.663 | ||
| 2 spectra, NGEDLGVAFR | 0.000 | 0.000 | 0.000 | 0.070 | 0.000 | 0.000 | 0.260 | 0.670 | ||
| 2 spectra, VVVVVPNEEDWK | 0.000 | 0.000 | 0.000 | 0.000 | 0.136 | 0.000 | 0.436 | 0.428 | ||
| 2 spectra, TAVPPK | 0.000 | 0.000 | 0.000 | 0.237 | 0.000 | 0.000 | 0.279 | 0.484 | ||
| 5 spectra, EEAYHSR | 0.000 | 0.000 | 0.000 | 0.030 | 0.000 | 0.000 | 0.354 | 0.616 | ||
| 2 spectra, DYEYNR | 0.000 | 0.000 | 0.000 | 0.083 | 0.009 | 0.000 | 0.395 | 0.513 | ||
| 2 spectra, DWQNYYYHHQQDR | 0.000 | 0.000 | 0.006 | 0.383 | 0.000 | 0.000 | 0.403 | 0.208 | ||
| 2 spectra, AYYEFR | 0.000 | 0.000 | 0.000 | 0.000 | 0.000 | 0.000 | 0.335 | 0.665 | ||
| 7 spectra, FPTLWSGAR | 0.000 | 0.000 | 0.000 | 0.000 | 0.000 | 0.000 | 0.311 | 0.689 |
| Plot | Mito | Lyso or Perox | ER | Golgi | PM | Cytosol | Nucleus | ||||||
| Expt B |
6 peptides |
10 spectra |
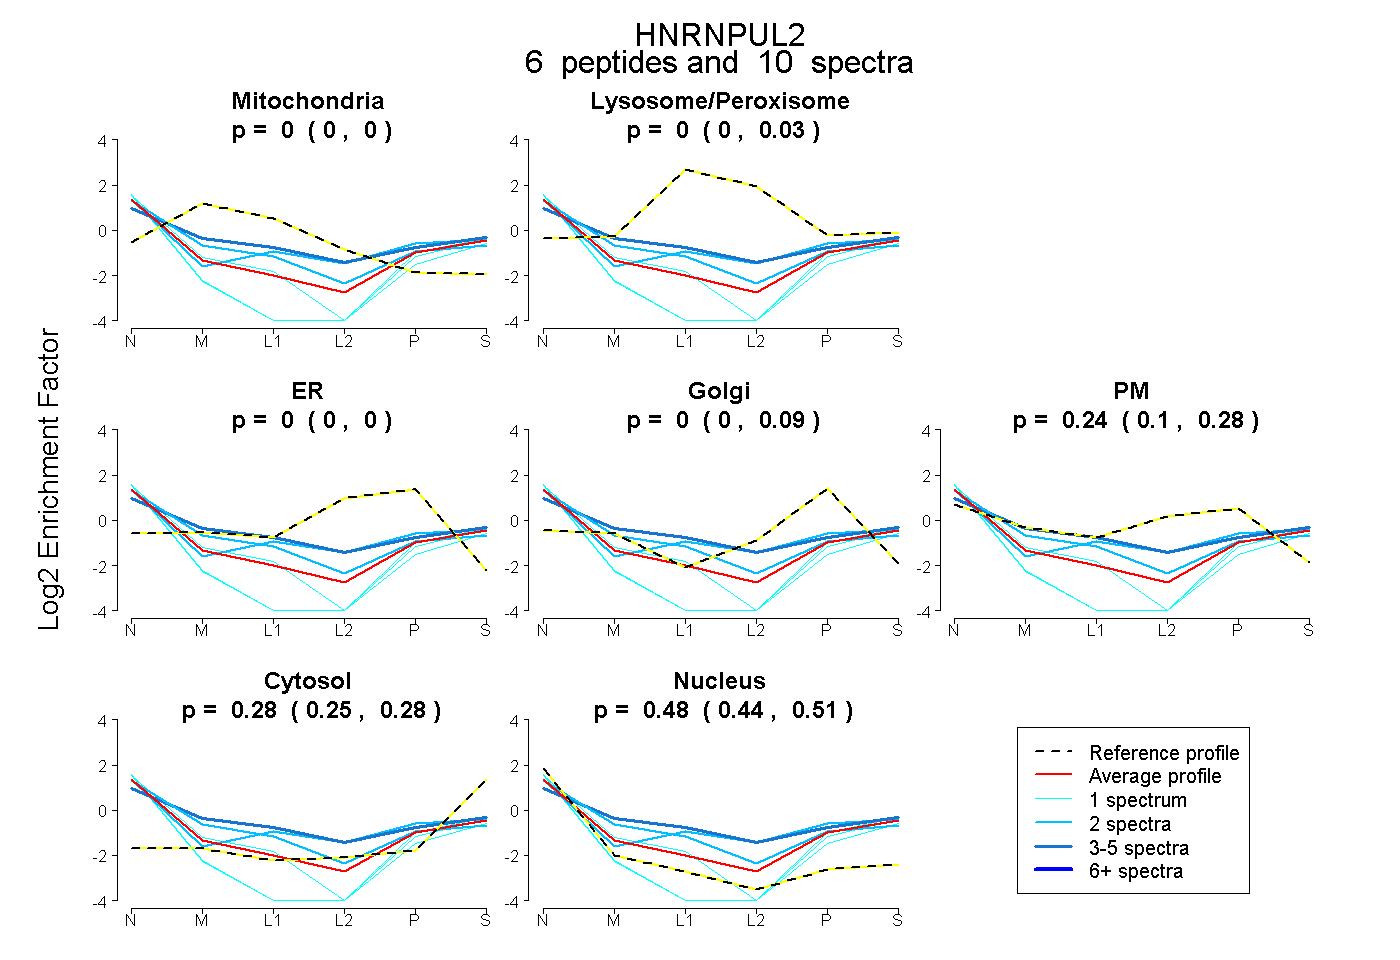 |
0.000 0.000 | 0.000 |
0.000 0.000 | 0.033 |
0.000 0.000 | 0.000 |
0.000 0.000 | 0.090 |
0.244 0.101 | 0.279 |
0.278 0.253 | 0.284 |
0.478 0.441 | 0.514 |
|||
| Plot | Lyso | Other | |||||||||||
| Expt C |
7 peptides |
9 spectra |
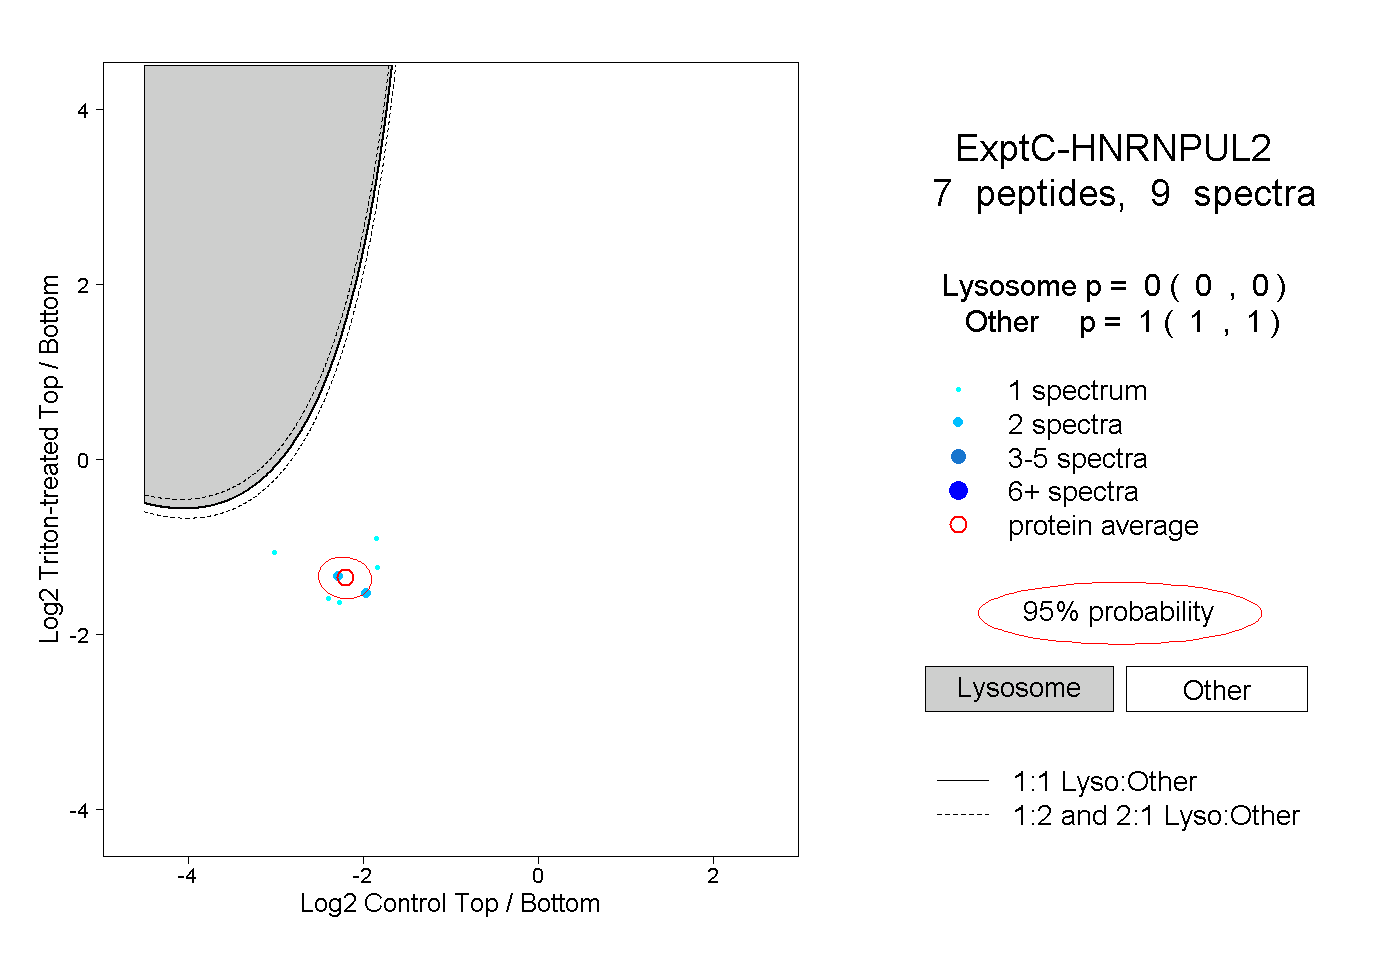 |
0.000 0.000 | 0.000 |
1.000 1.000 | 1.000 |