14
14peptides
spectra
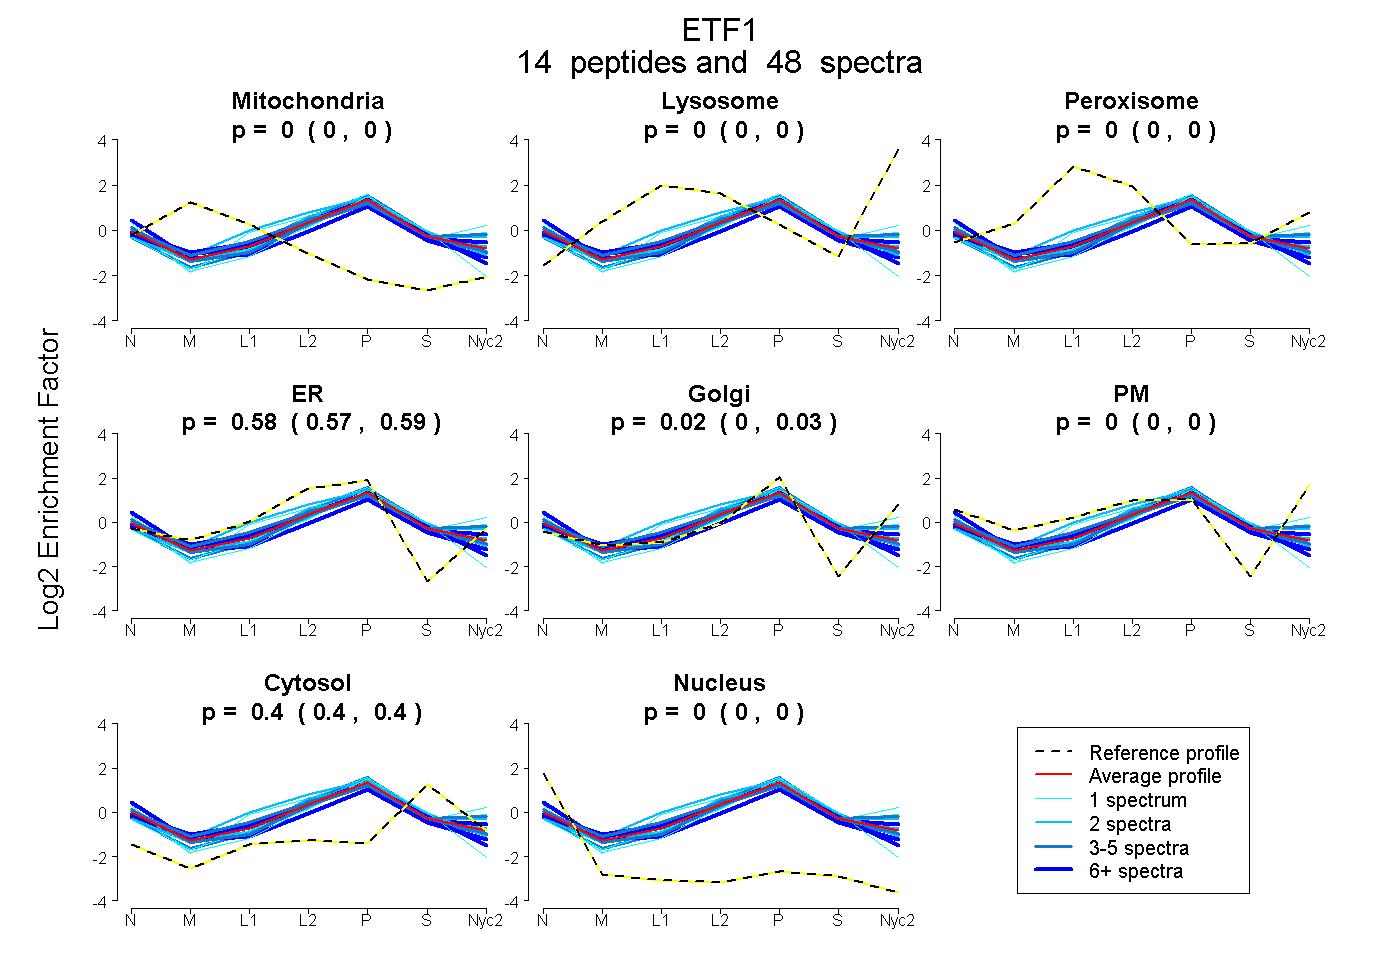
0.000 | 0.000
0.000 | 0.000
0.000 | 0.000
0.571 | 0.593
0.003 | 0.029
0.000 | 0.000
0.397 | 0.403
0.000 | 0.000
5peptides
spectra
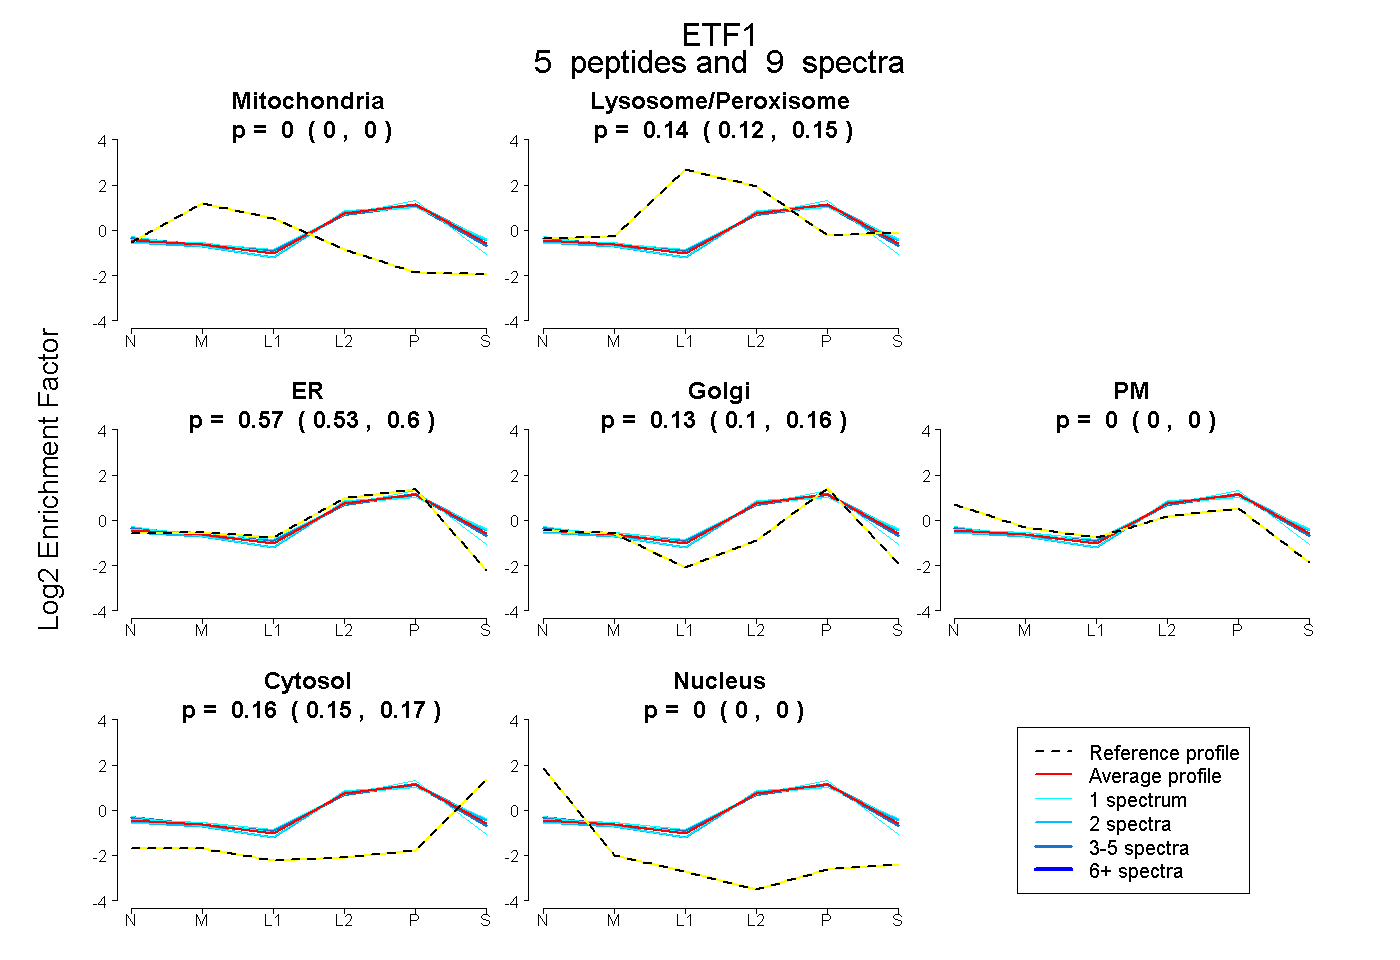
0.000 | 0.000
0.120 | 0.153
0.527 | 0.604
0.098 | 0.160
0.000 | 0.000
0.150 | 0.174
0.000 | 0.000