 14
14peptides
spectra
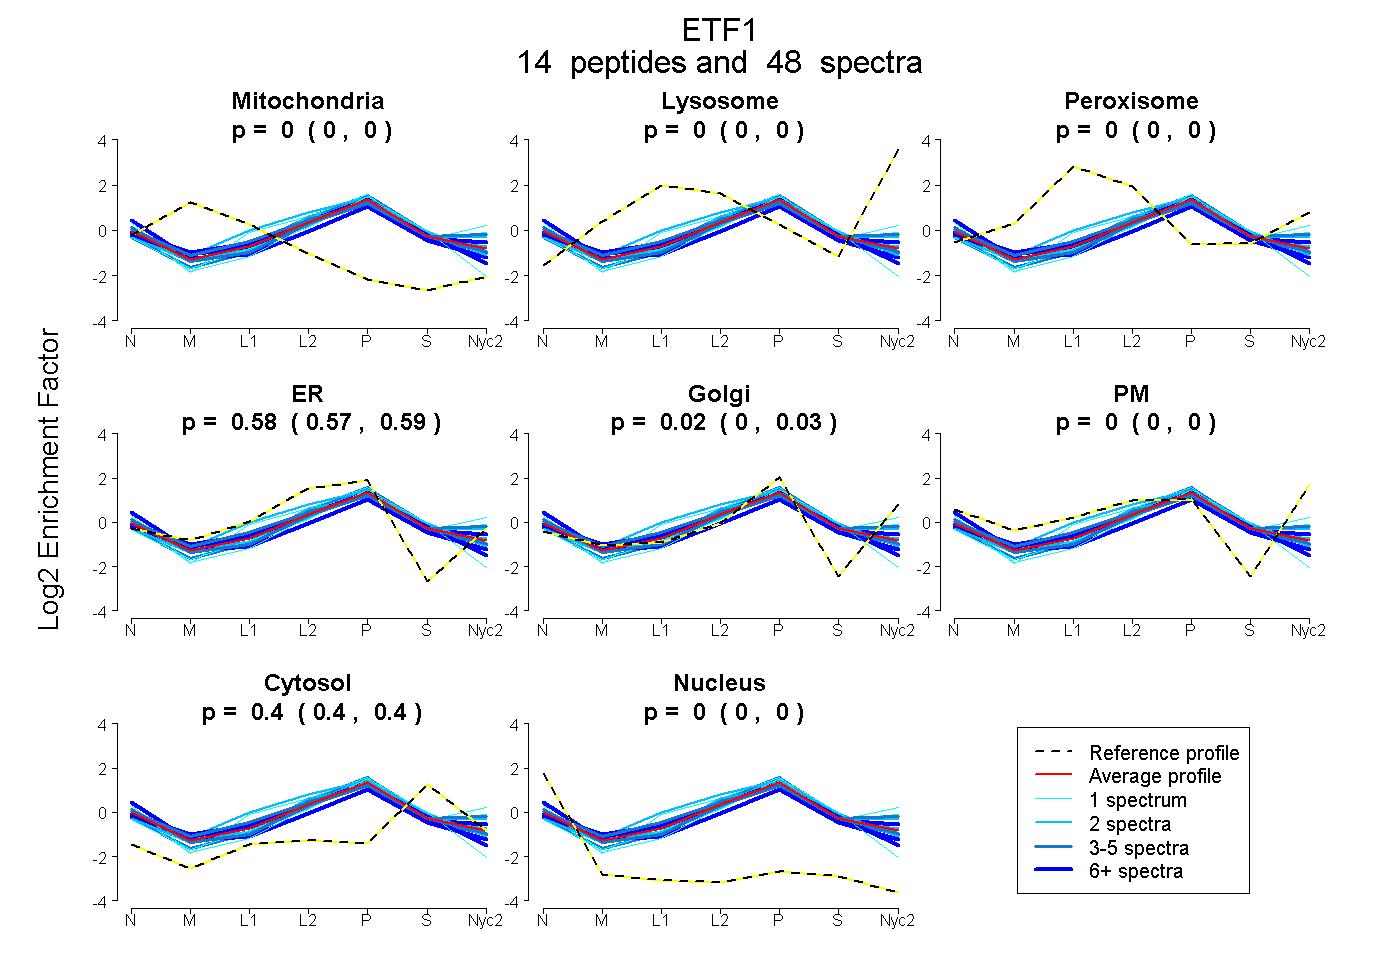
0.000 | 0.000
0.000 | 0.000
0.000 | 0.000
0.571 | 0.593
0.003 | 0.029
0.000 | 0.000
0.397 | 0.403
0.000 | 0.000
| Plot | Mito | Lyso | Perox | ER | Golgi | PM | Cytosol | Nucleus | |||||
| Expt A |
14 peptides |
48 spectra |
|
0.000 0.000 | 0.000 |
0.000 0.000 | 0.000 |
0.000 0.000 | 0.000 |
0.583 0.571 | 0.593 |
0.017 0.003 | 0.029 |
0.000 0.000 | 0.000 |
0.400 0.397 | 0.403 |
0.000 0.000 | 0.000 |
| 3 spectra, YVLHCQGTEEEK | 0.000 | 0.000 | 0.000 | 0.562 | 0.007 | 0.000 | 0.408 | 0.023 | ||
| 2 spectra, SHFTDK | 0.000 | 0.000 | 0.126 | 0.538 | 0.041 | 0.000 | 0.295 | 0.000 | ||
| 2 spectra, VNVAGLVLAGSADFK | 0.000 | 0.000 | 0.000 | 0.550 | 0.000 | 0.000 | 0.450 | 0.000 | ||
| 1 spectrum, VAETAVQLFISGDK | 0.000 | 0.000 | 0.000 | 0.242 | 0.318 | 0.058 | 0.381 | 0.000 | ||
| 1 spectrum, ILYLTPEQEK | 0.000 | 0.000 | 0.052 | 0.368 | 0.152 | 0.127 | 0.301 | 0.000 | ||
| 8 spectra, SQEGSQFVK | 0.000 | 0.000 | 0.000 | 0.586 | 0.000 | 0.000 | 0.413 | 0.001 | ||
| 6 spectra, TELSQSDMFDQR | 0.000 | 0.000 | 0.023 | 0.508 | 0.116 | 0.000 | 0.353 | 0.000 | ||
| 2 spectra, NVEIWK | 0.000 | 0.000 | 0.000 | 0.550 | 0.080 | 0.000 | 0.371 | 0.000 | ||
| 7 spectra, SLEAAR | 0.000 | 0.000 | 0.000 | 0.523 | 0.022 | 0.000 | 0.350 | 0.106 | ||
| 3 spectra, GFGGIGGILR | 0.000 | 0.000 | 0.000 | 0.628 | 0.000 | 0.000 | 0.372 | 0.000 | ||
| 5 spectra, YFDEISQDTGK | 0.000 | 0.000 | 0.031 | 0.403 | 0.067 | 0.144 | 0.354 | 0.000 | ||
| 5 spectra, FTVDLPK | 0.000 | 0.000 | 0.000 | 0.525 | 0.034 | 0.000 | 0.441 | 0.000 | ||
| 2 spectra, LSVLGAITSVQQR | 0.000 | 0.000 | 0.000 | 0.474 | 0.000 | 0.136 | 0.390 | 0.000 | ||
| 1 spectrum, YCFGVEDTLK | 0.000 | 0.000 | 0.000 | 0.521 | 0.000 | 0.000 | 0.443 | 0.036 |
| Plot | Mito | Lyso or Perox | ER | Golgi | PM | Cytosol | Nucleus | ||||||
| Expt B |
5 peptides |
9 spectra |
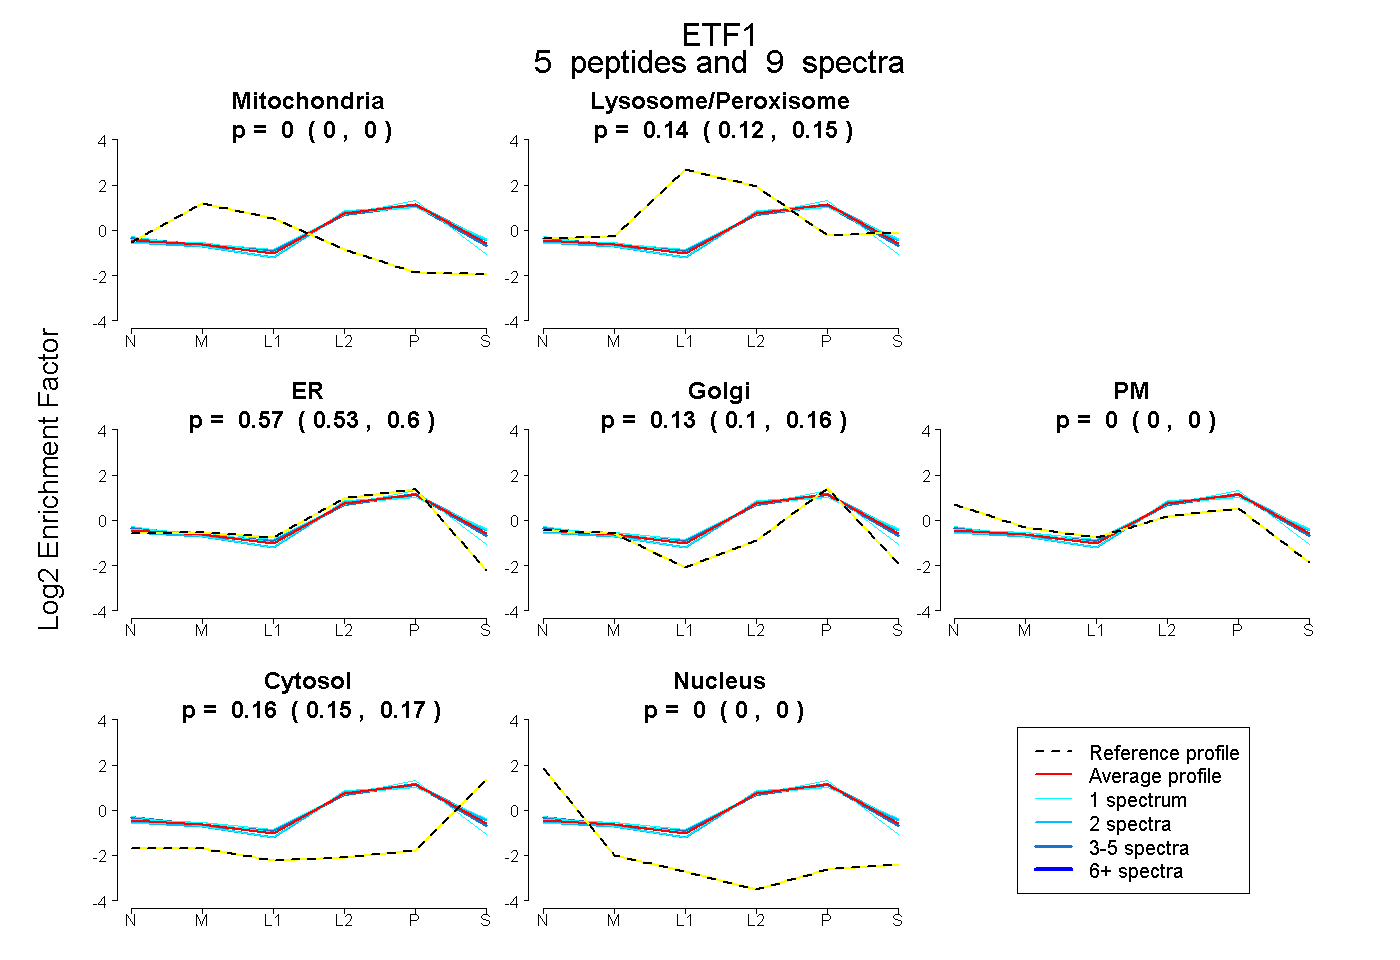 |
0.000 0.000 | 0.000 |
0.137 0.120 | 0.153 |
0.570 0.527 | 0.604 |
0.130 0.098 | 0.160 |
0.000 0.000 | 0.000 |
0.163 0.150 | 0.174 |
0.000 0.000 | 0.000 |
|||
| Plot | Lyso | Other | |||||||||||
| Expt C |
12 peptides |
44 spectra |
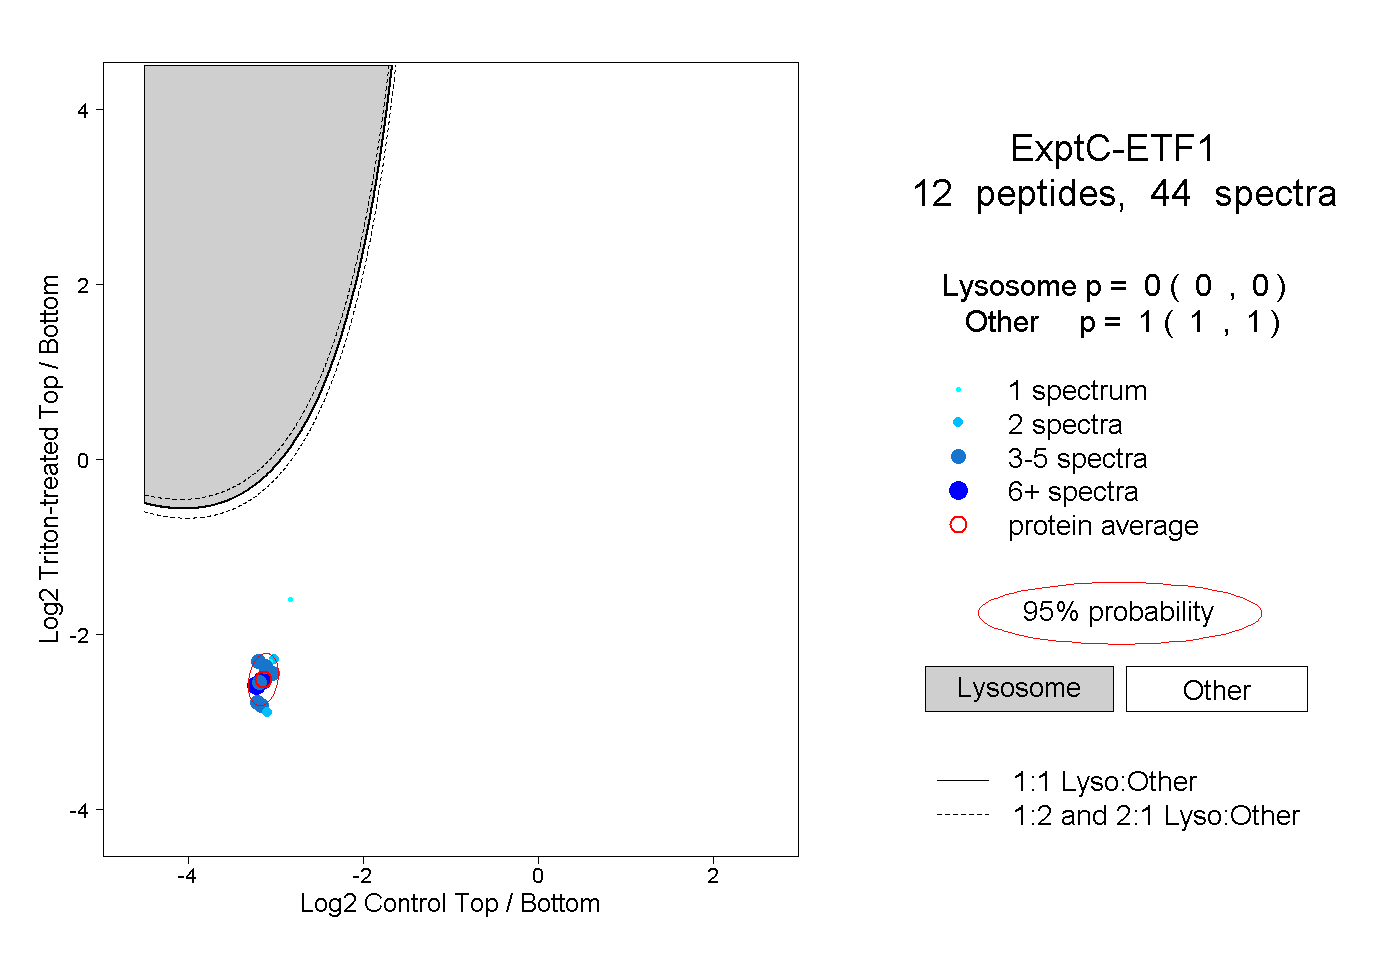 |
0.000 0.000 | 0.000 |
1.000 1.000 | 1.000 |
||||||||
| Plot | Lyso | Other | |||||||||||
| Expt D |
2 peptides |
2 spectra |
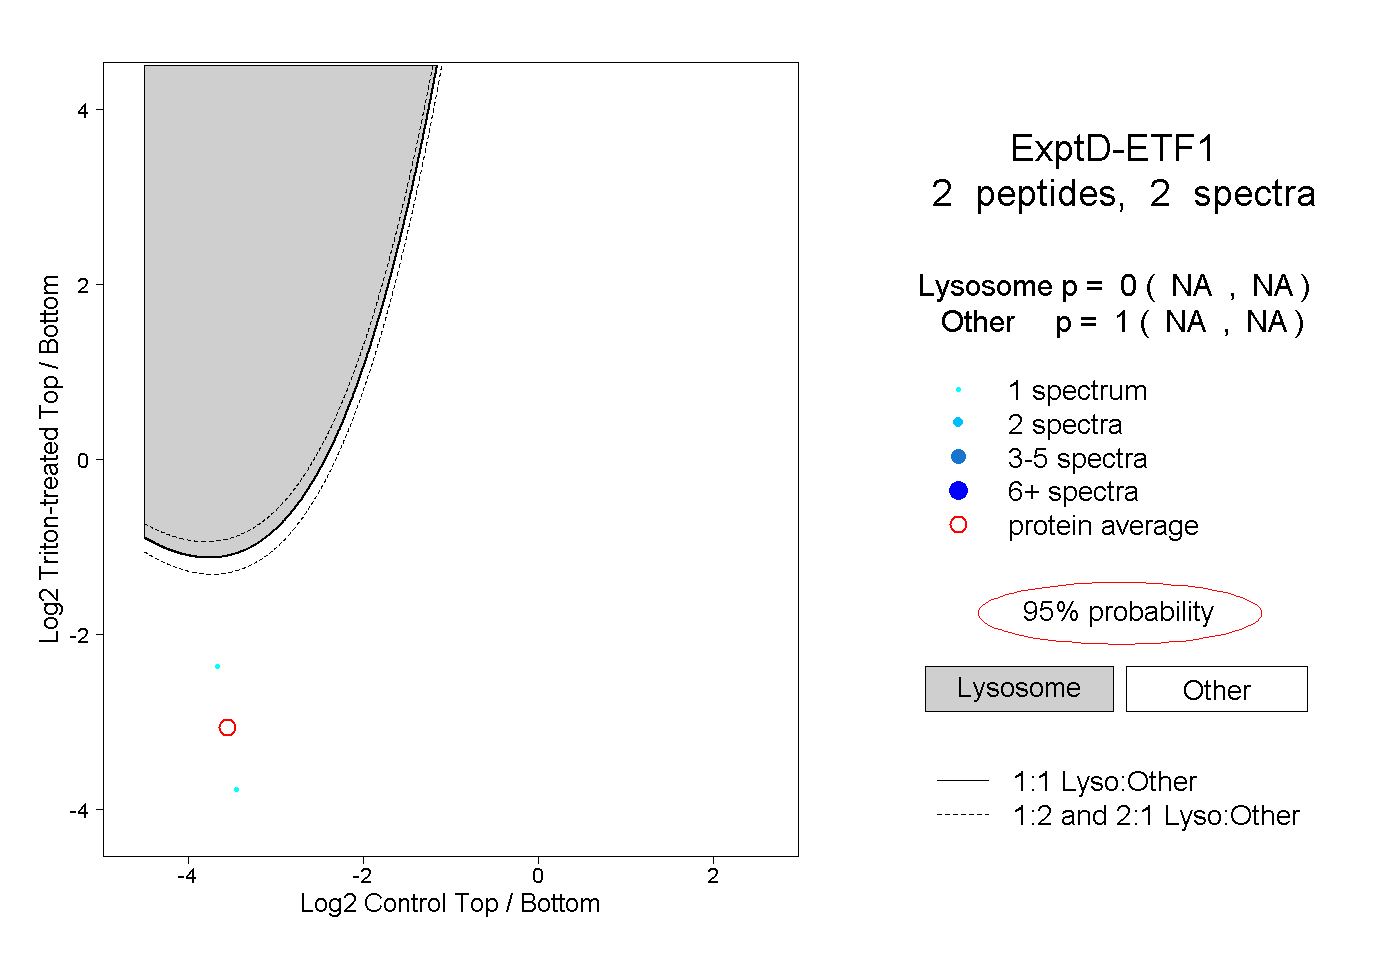 |
0.000 NA | NA |
1.000 NA | NA |