 3
3peptides
spectra
0.000 | 0.148
0.000 | 0.000
0.000 | 0.025
0.000 | 0.076
0.010 | 0.167
0.000 | 0.109
0.684 | 0.796
0.000 | 0.101
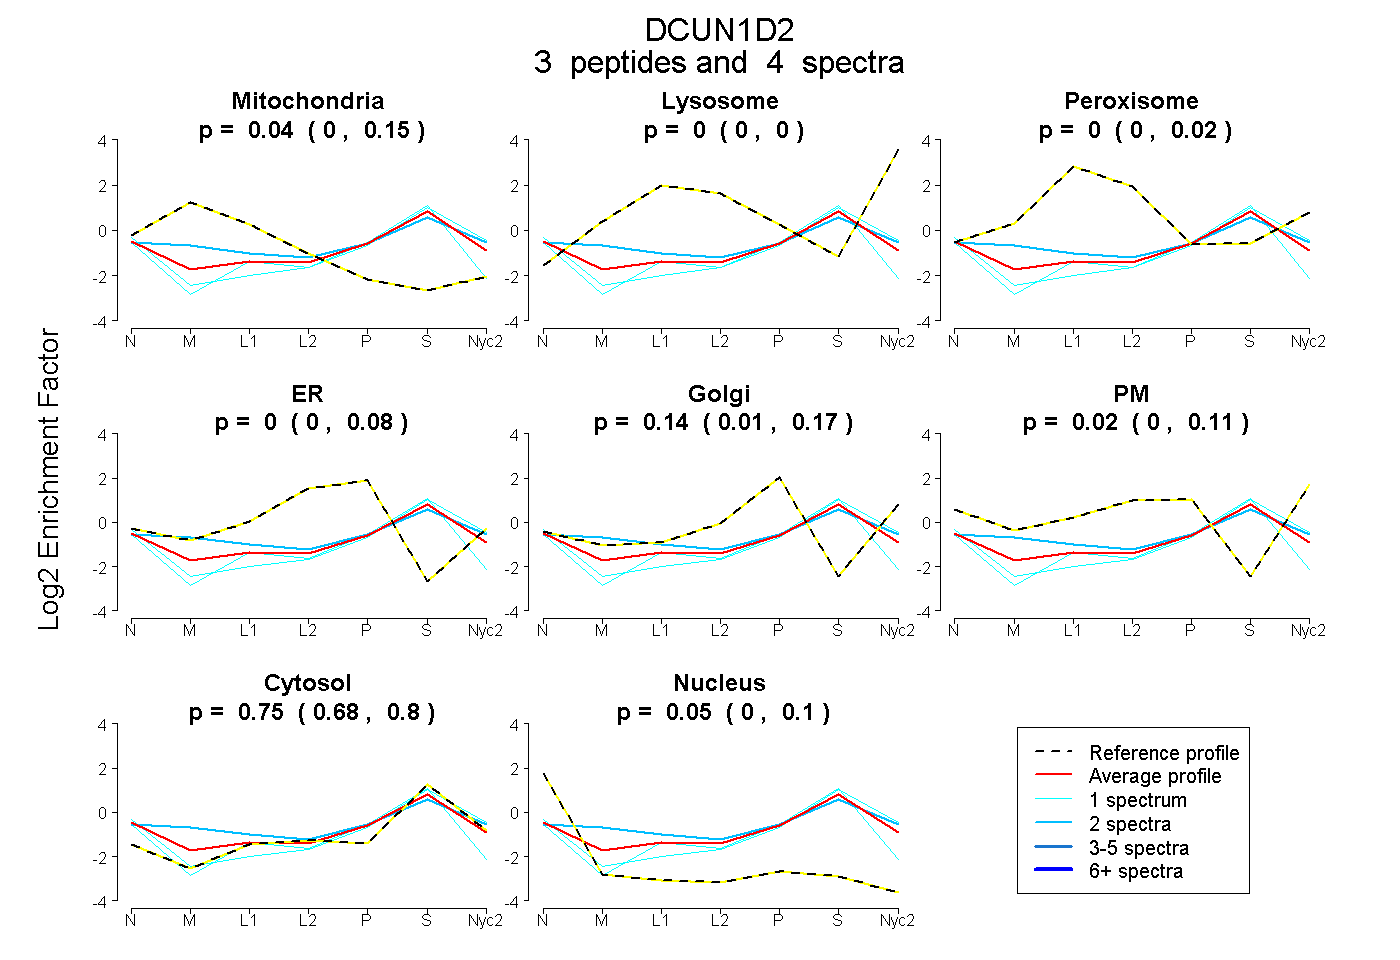
| Plot | Mito | Lyso | Perox | ER | Golgi | PM | Cytosol | Nucleus | |||||
| Expt A |
3 peptides |
4 spectra |
|
0.043 0.000 | 0.148 |
0.000 0.000 | 0.000 |
0.000 0.000 | 0.025 |
0.000 0.000 | 0.076 |
0.139 0.010 | 0.167 |
0.017 0.000 | 0.109 |
0.749 0.684 | 0.796 |
0.051 0.000 | 0.101 |