SHPK
[ENSRNOP00000026351]
Main page
| | | Plot |
Mito |
Lyso |
|
Perox |
ER |
Golgi |
PM |
Cytosol |
Nucleus |
|
| Expt A |
 10
10
peptides |
24
spectra |
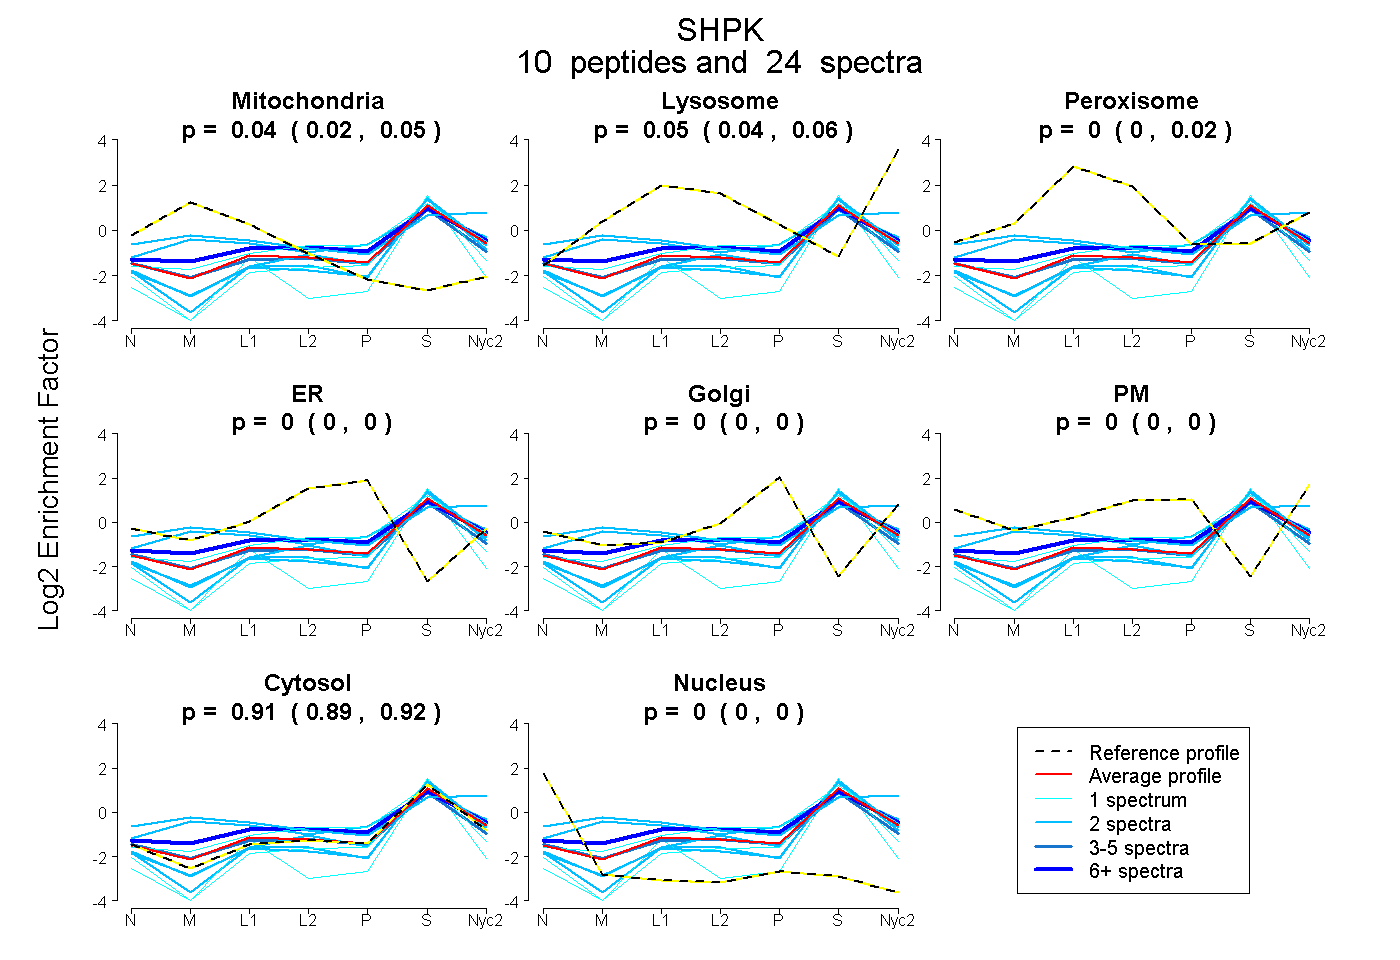 |
0.039
0.018 | 0.054 |
0.054
0.035 | 0.062 |
|
0.000
0.000 | 0.015 |
0.000
0.000 | 0.000 |
0.000
0.000 | 0.000 |
0.000
0.000 | 0.000 |
0.907
0.889 | 0.923 |
0.000
0.000 | 0.000 |
|
| | | Plot |
Mito |
|
Lyso or Perox |
|
ER |
Golgi |
PM |
Cytosol |
Nucleus |
|
| Expt B |
3
peptides |
8
spectra |
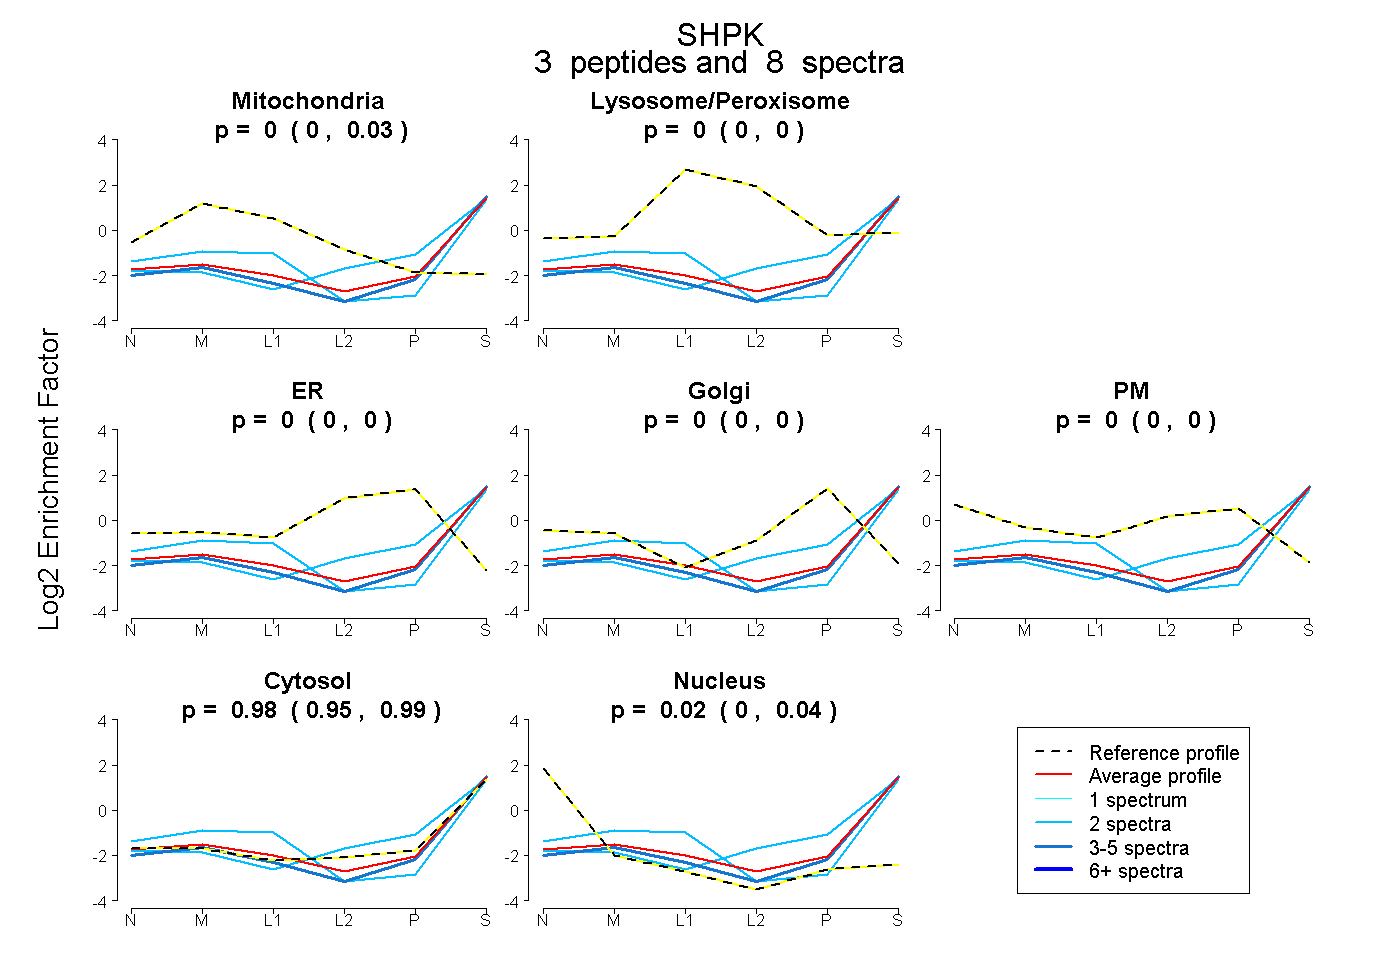 |
0.000
0.000 | 0.032 |
|
0.000
0.000 | 0.000 |
|
0.000
0.000 | 0.000 |
0.000
0.000 | 0.000 |
0.000
0.000 | 0.000 |
0.979
0.951 | 0.992 |
0.021
0.000 | 0.042 |
|
| 4 spectra, VVGSGSALSR |
0.000 |
|
0.000 |
|
0.000 |
0.000 |
0.000 |
0.987 |
0.013 |
|
| 2 spectra, HLPDQLASVTR |
0.148 |
|
0.000 |
|
0.000 |
0.000 |
0.000 |
0.819 |
0.034 |
|
| 2 spectra, GSAPVFEPR |
0.000 |
|
0.000 |
|
0.000 |
0.089 |
0.000 |
0.911 |
0.000 |
|
| | | Plot |
|
Lyso |
|
|
|
|
|
|
|
Other |
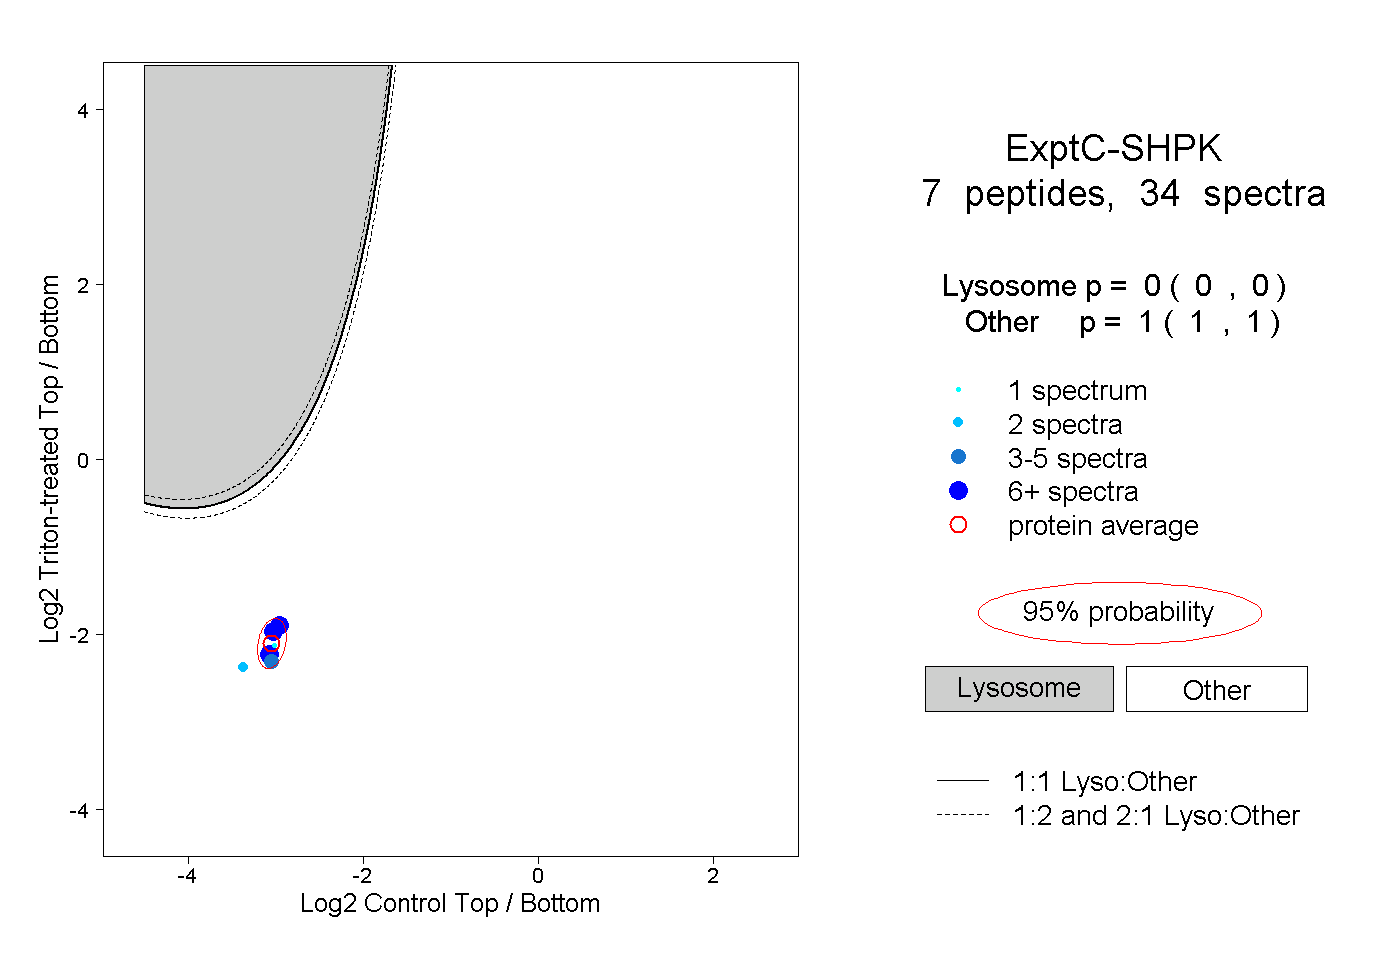
| Expt C |
7
peptides |
34
spectra |
 |
|
0.000
0.000 | 0.000 |
|
|
|
|
|
|
|
1.000
1.000 | 1.000 |
| | | Plot |
|
Lyso |
|
|
|
|
|
|
|
Other |
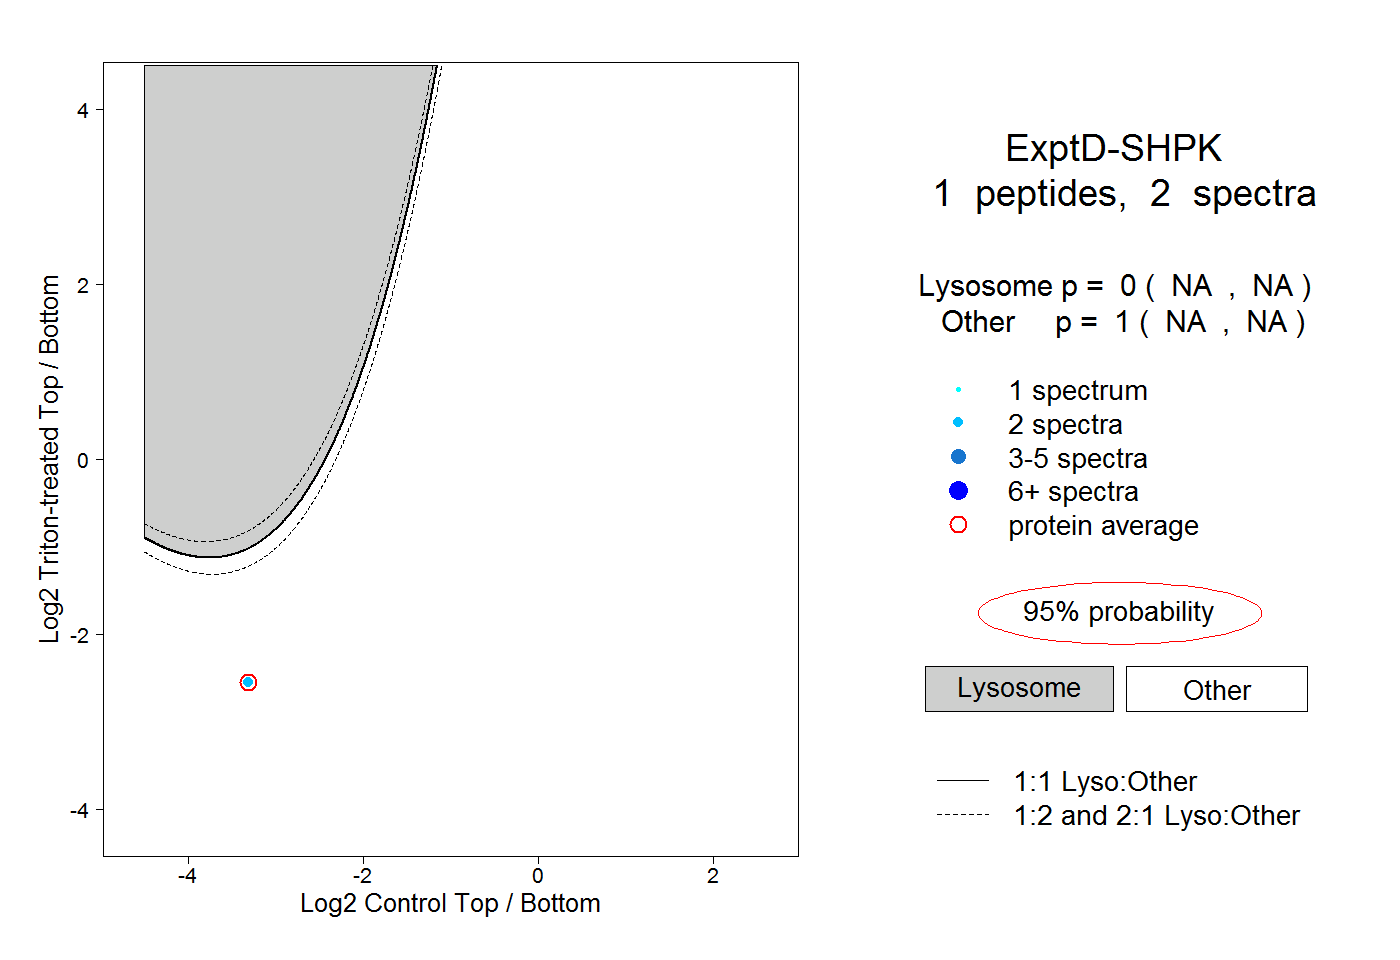
| Expt D |
1
peptide |
2
spectra |
 |
|
0.000
NA | NA |
|
|
|
|
|
|
|
1.000
NA | NA |