 56
56peptides
spectra

0.945 | 0.946
0.000 | 0.000
0.000 | 0.000
0.000 | 0.000
0.000 | 0.000
0.000 | 0.000
0.000 | 0.000
0.054 | 0.055
50peptides
spectra

0.944 | 0.946
0.000 | 0.000
0.000 | 0.000
0.000 | 0.000
0.000 | 0.000
0.032 | 0.035
0.020 | 0.022
62peptides
spectra
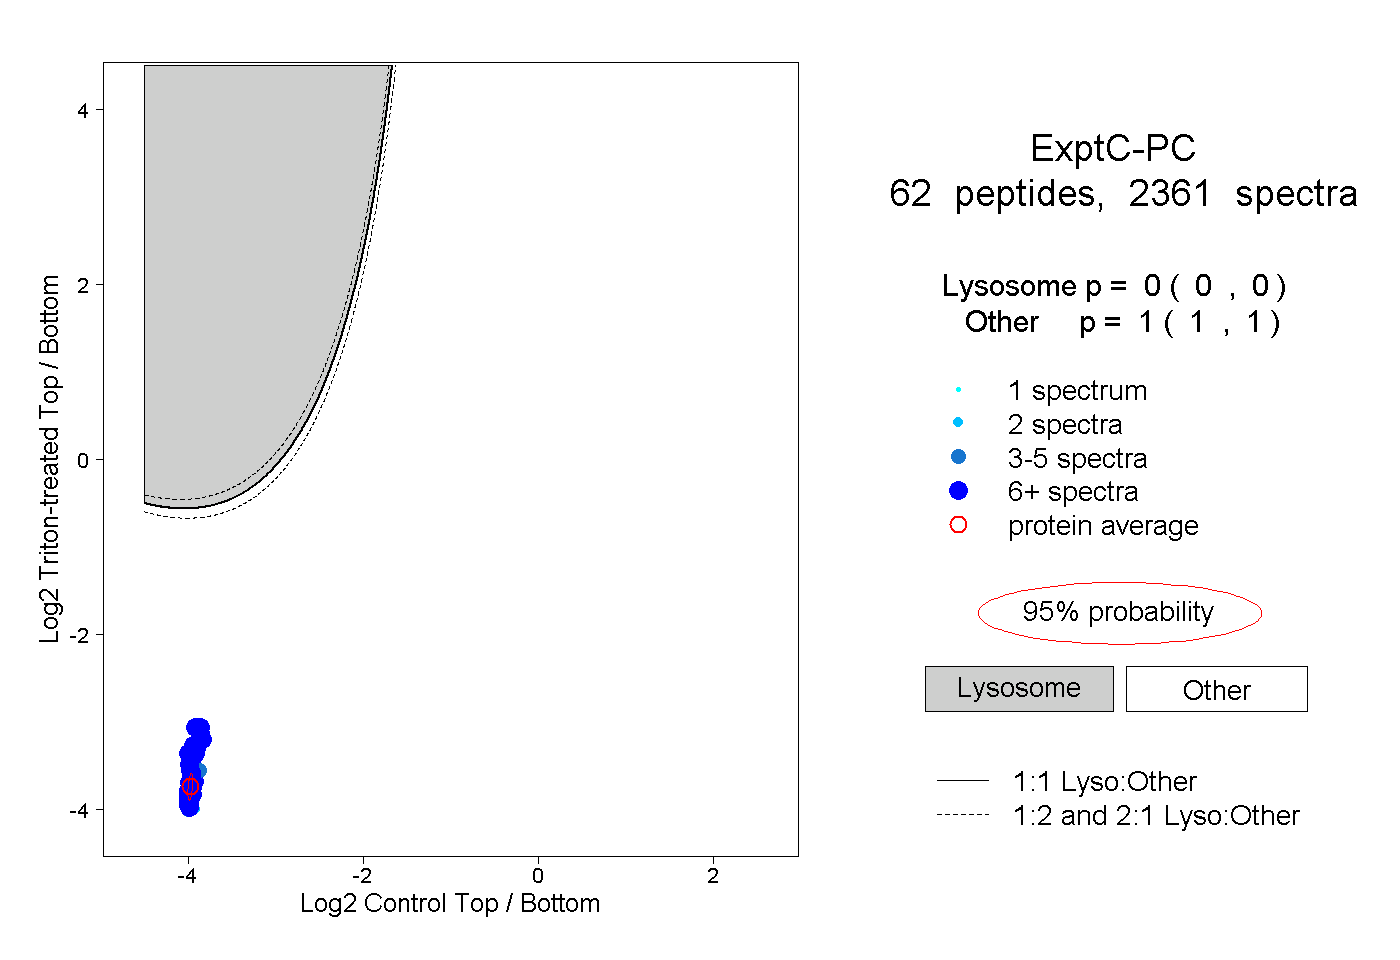
0.000 | 0.000
1.000 | 1.000
41peptides
spectra
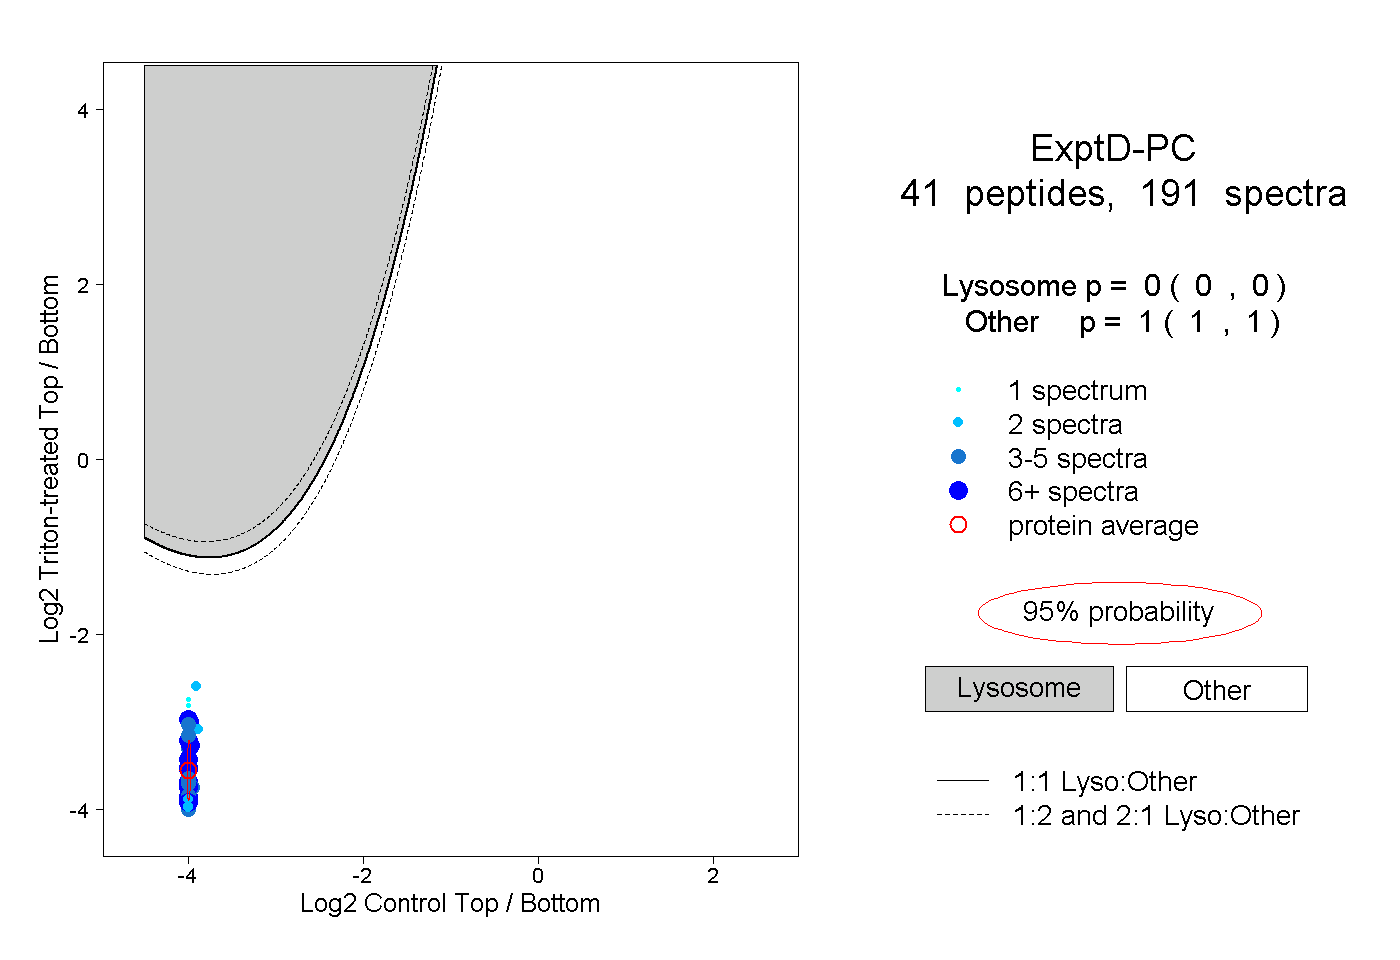
0.000 | 0.000
1.000 | 1.000