 7
7peptides
spectra
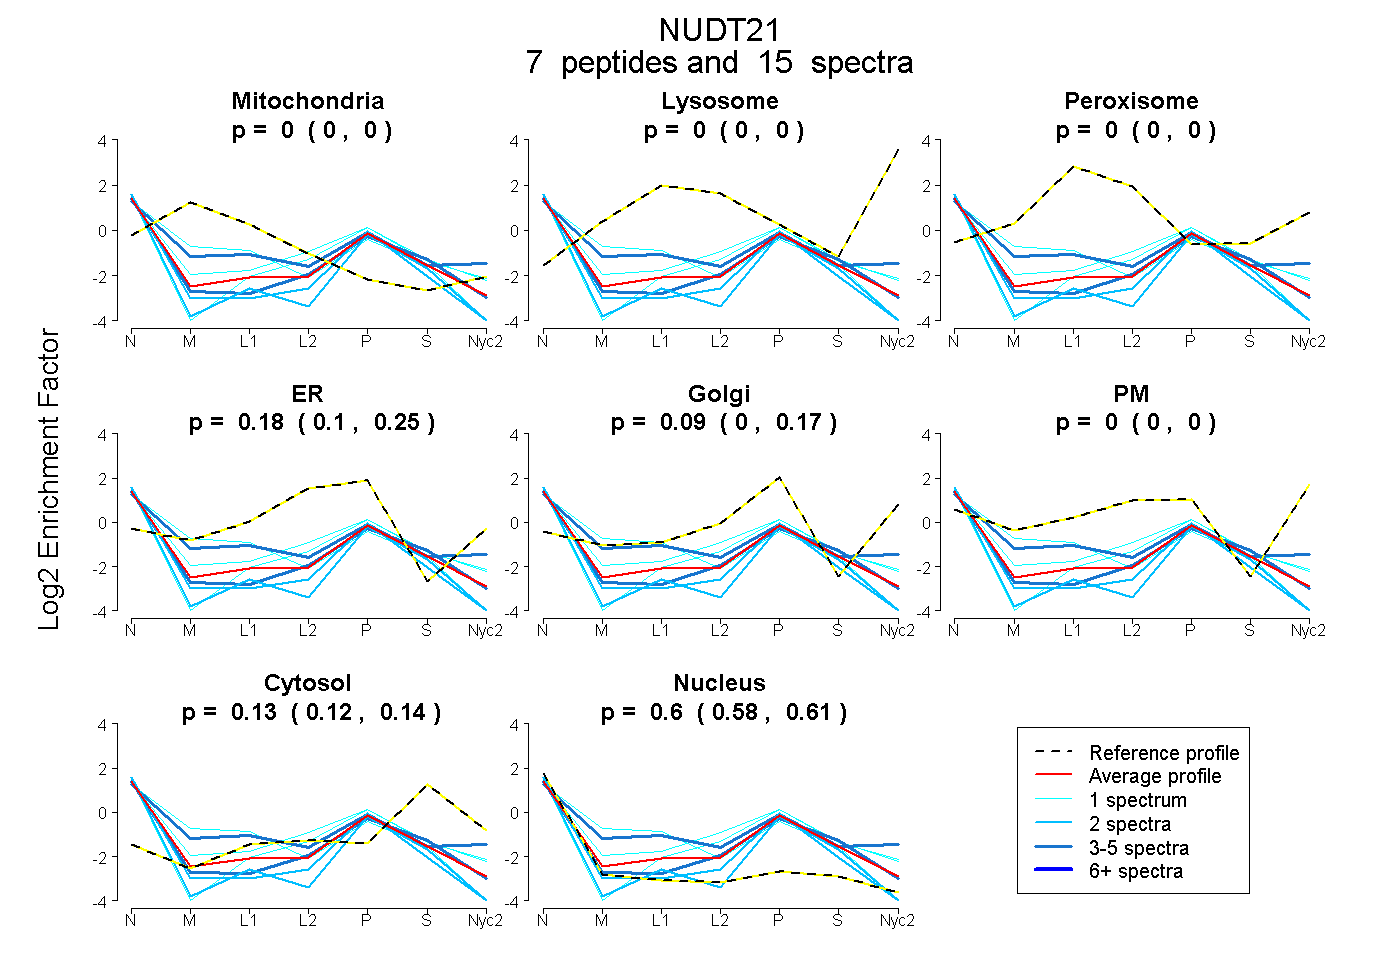
0.000 | 0.000
0.000 | 0.000
0.000 | 0.000
0.102 | 0.253
0.000 | 0.168
0.000 | 0.000
0.117 | 0.141
0.575 | 0.613
1peptide
spectrum
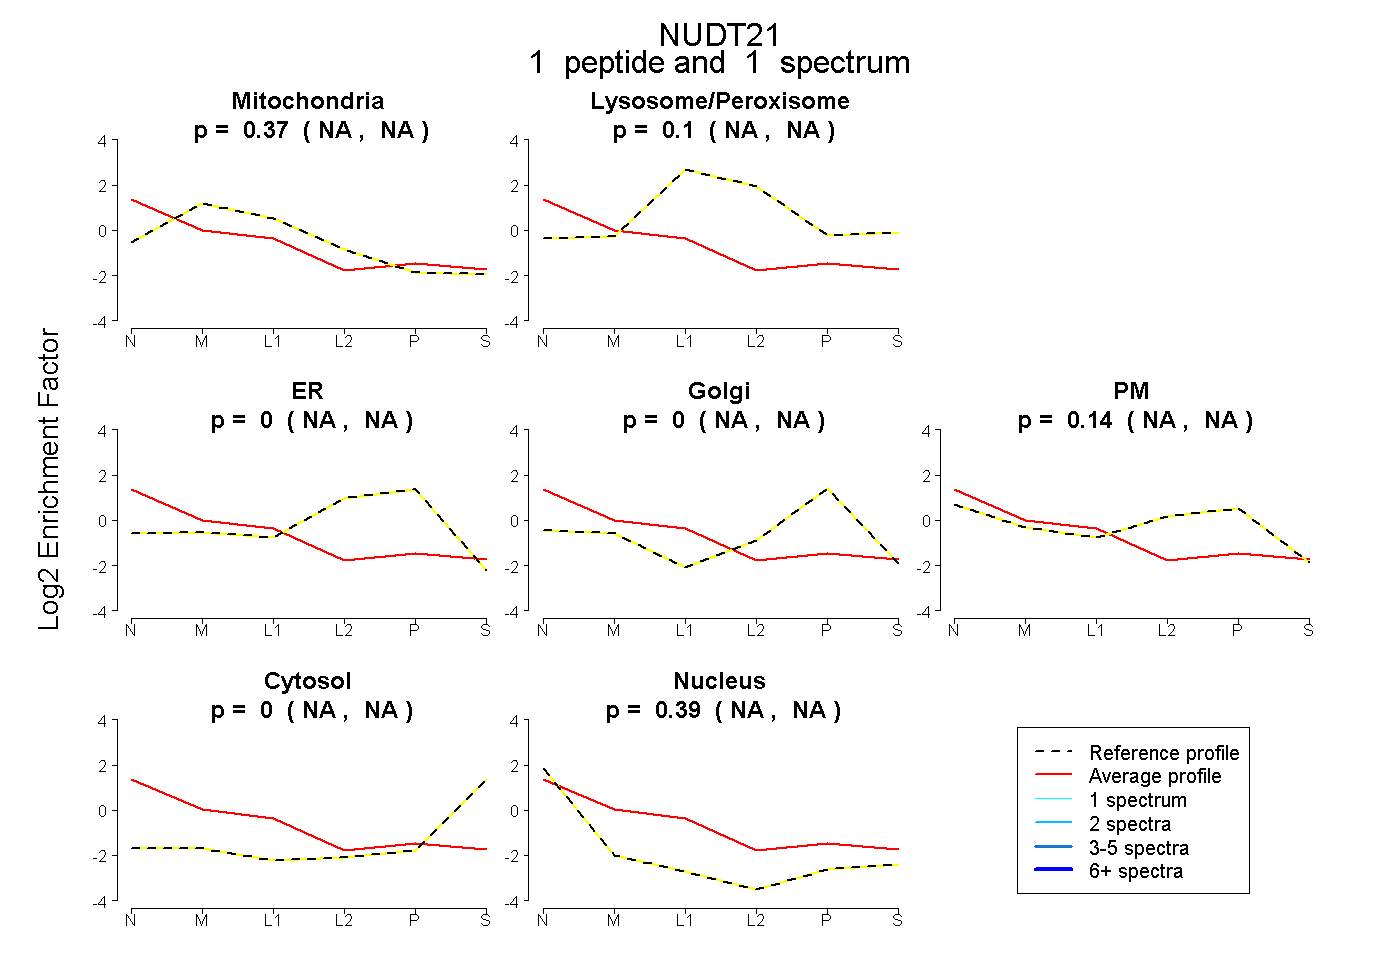
NA | NA
NA | NA
NA | NA
NA | NA
NA | NA
NA | NA
NA | NA
1peptide
spectra
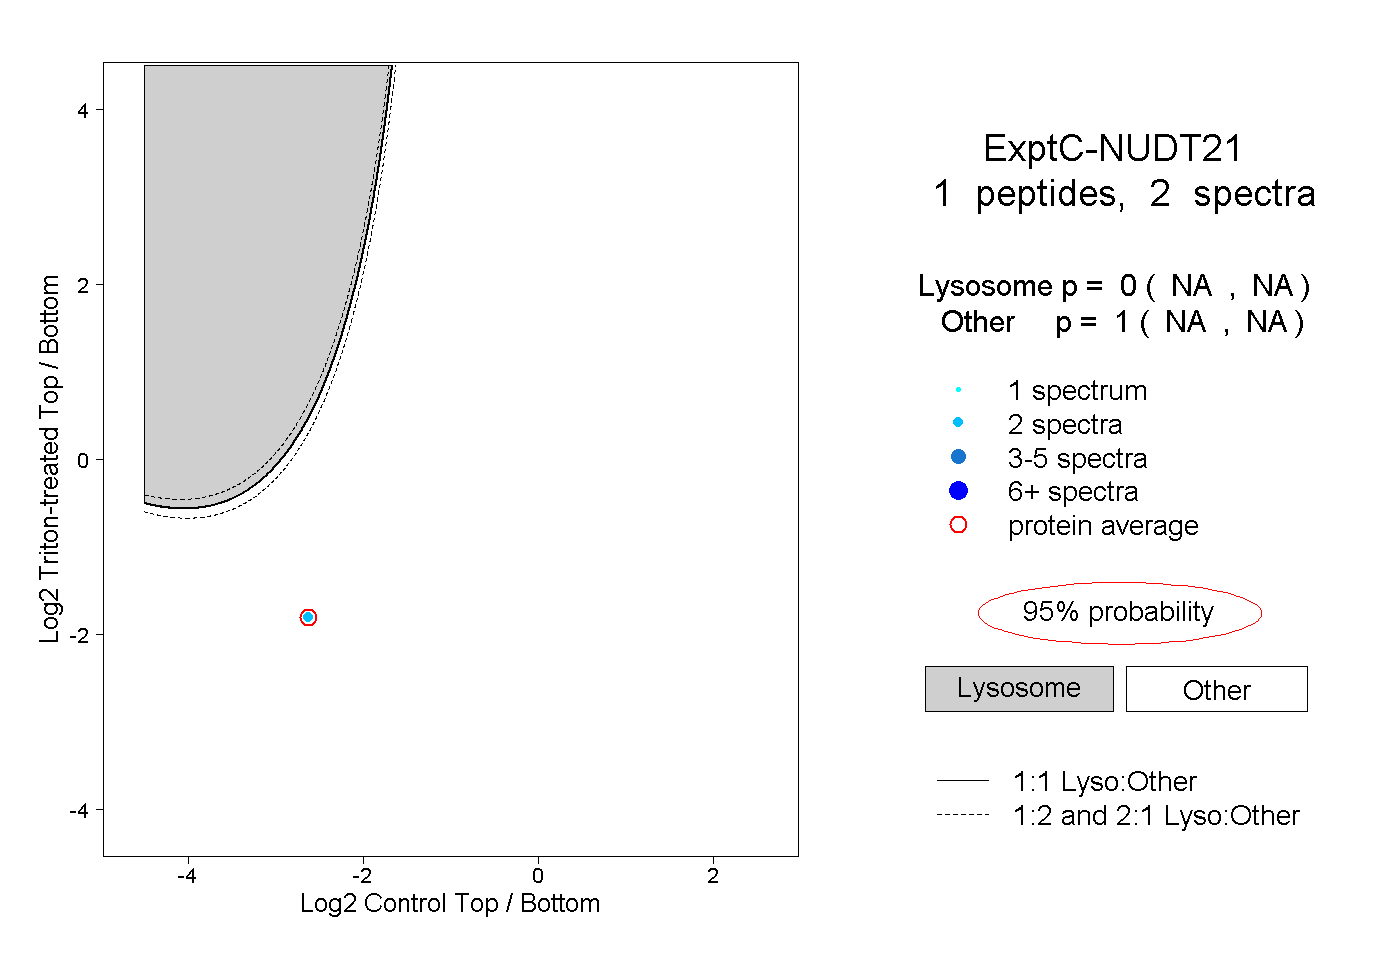
NA | NA
NA | NA
1peptide
spectrum
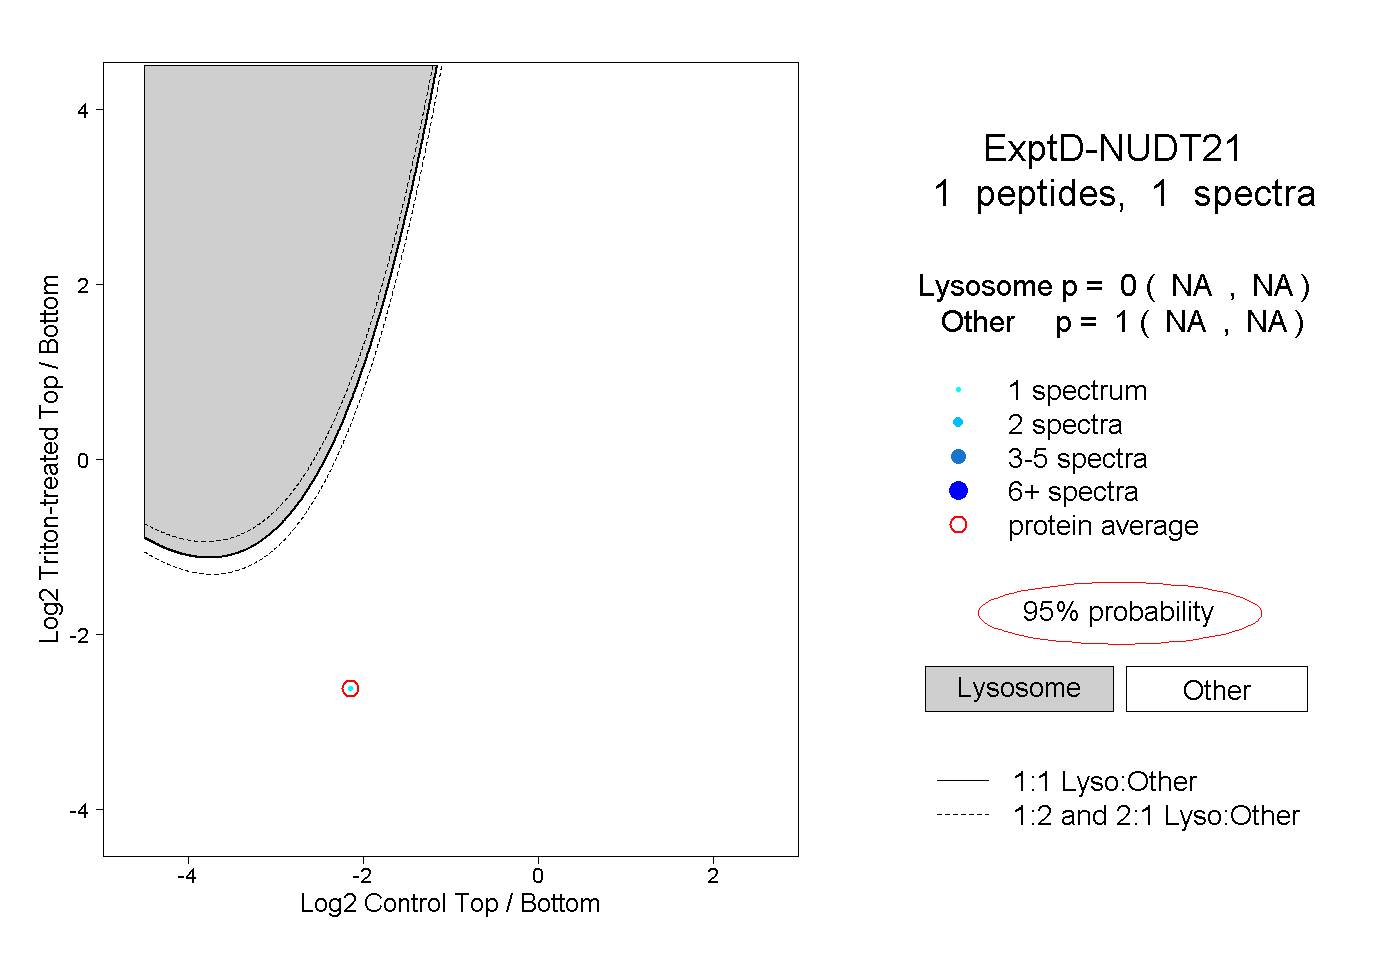
NA | NA
NA | NA