 8
8peptides
spectra
0.040 | 0.110
0.000 | 0.000
0.000 | 0.000
0.411 | 0.472
0.000 | 0.000
0.000 | 0.000
0.000 | 0.000
0.451 | 0.500
3peptides
spectra
0.000 | 0.000
1.000 | 1.000
| Plot | Mito | Lyso | Perox | ER | Golgi | PM | Cytosol | Nucleus | |||||
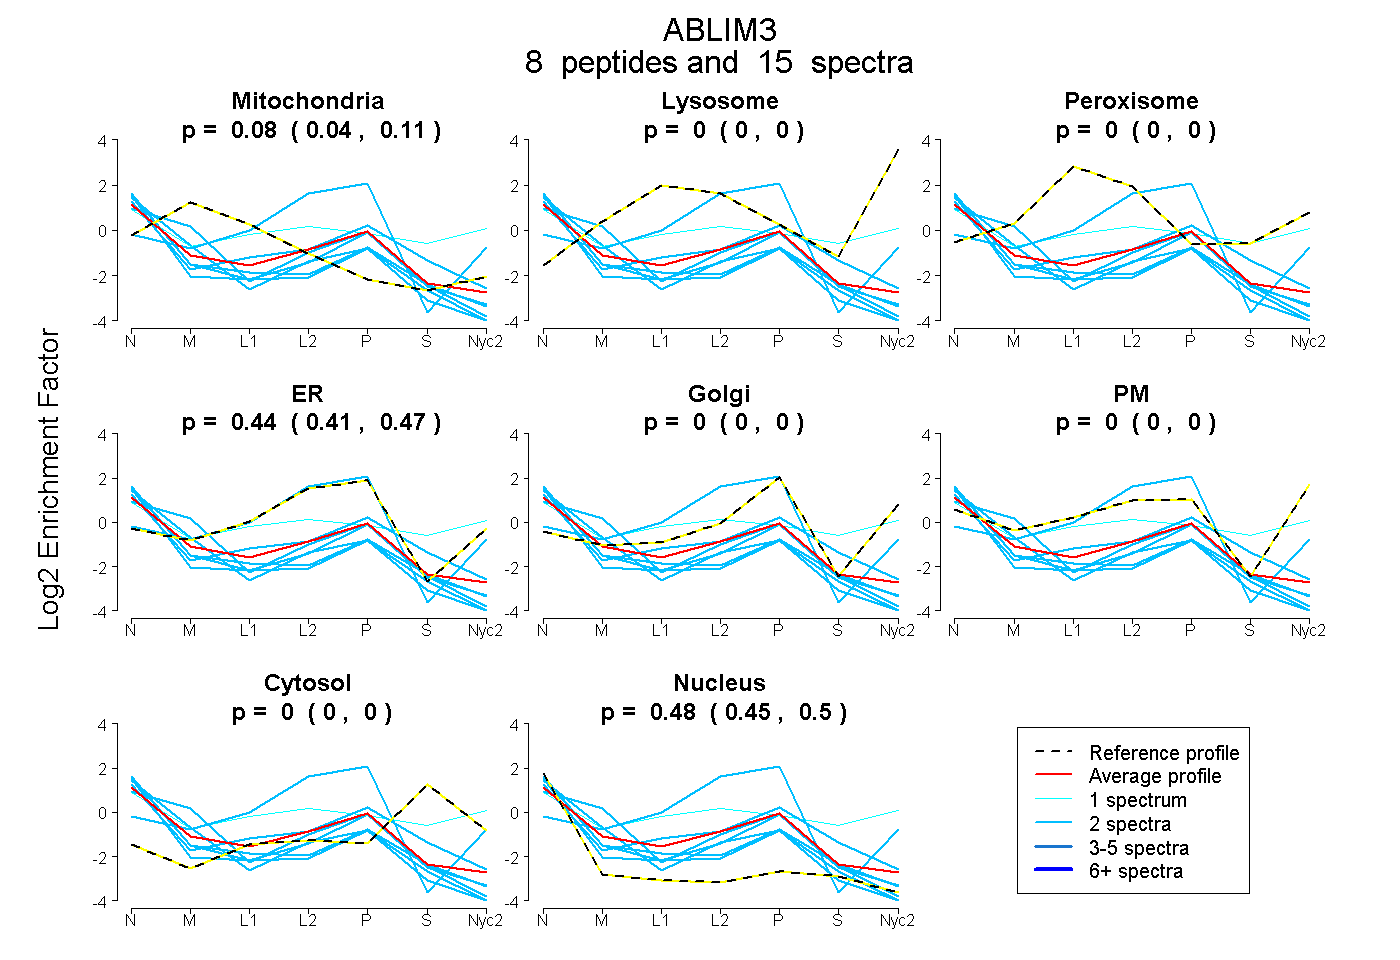
| Expt A |
8 peptides |
15 spectra |
|
0.078 0.040 | 0.110 |
0.000 0.000 | 0.000 |
0.000 0.000 | 0.000 |
0.444 0.411 | 0.472 |
0.000 0.000 | 0.000 |
0.000 0.000 | 0.000 |
0.000 0.000 | 0.000 |
0.478 0.451 | 0.500 |
||
| Plot | Lyso | Other | |||||||||||
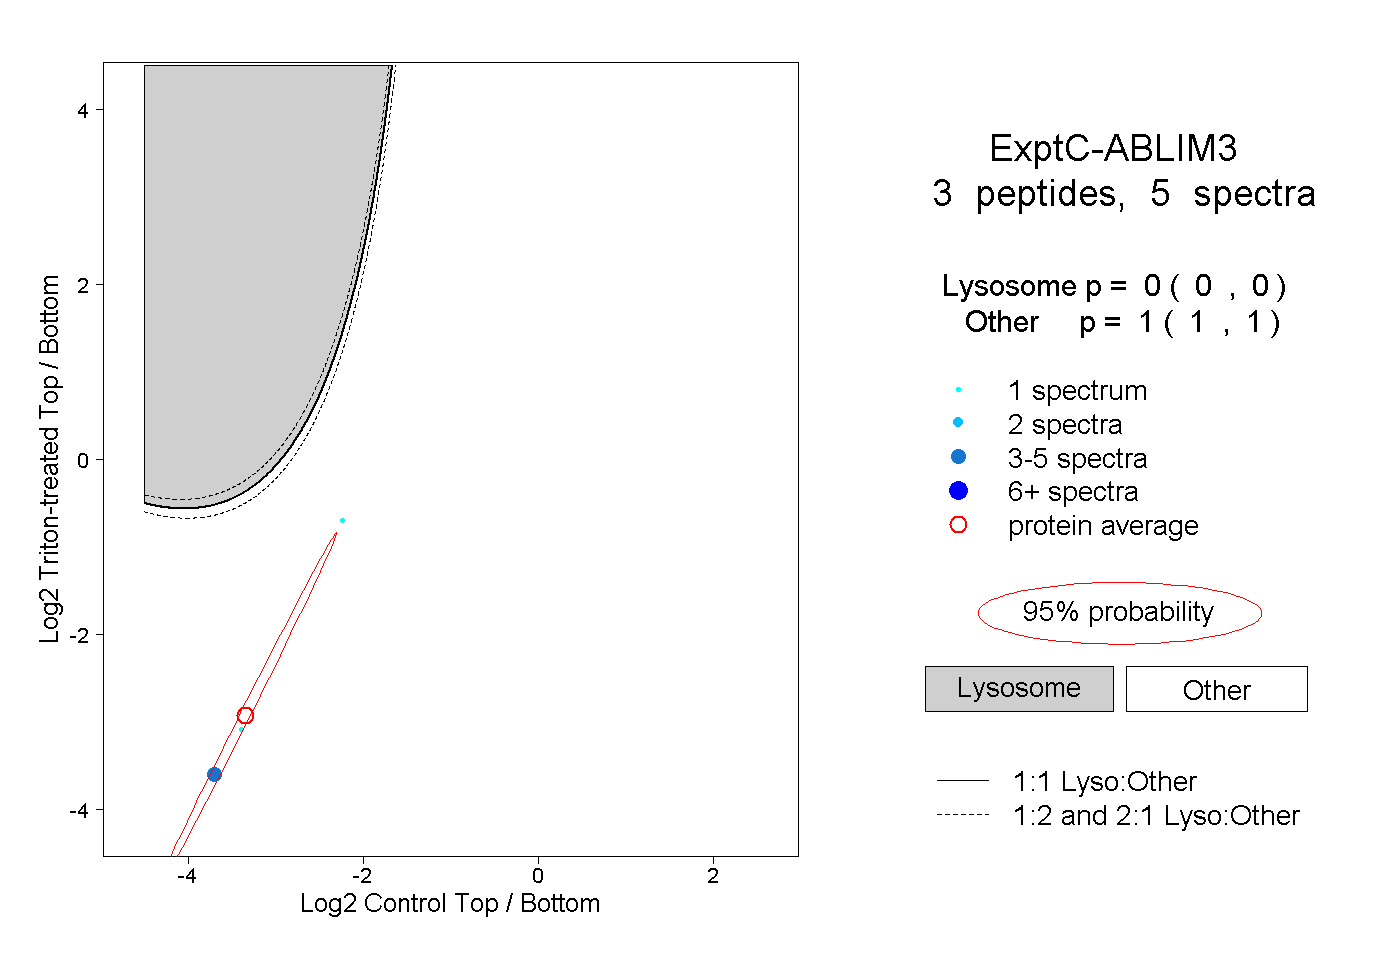
| Expt C |
3 peptides |
5 spectra |
|
0.000 0.000 | 0.000 |
1.000 1.000 | 1.000 |