 3
3peptides
spectra
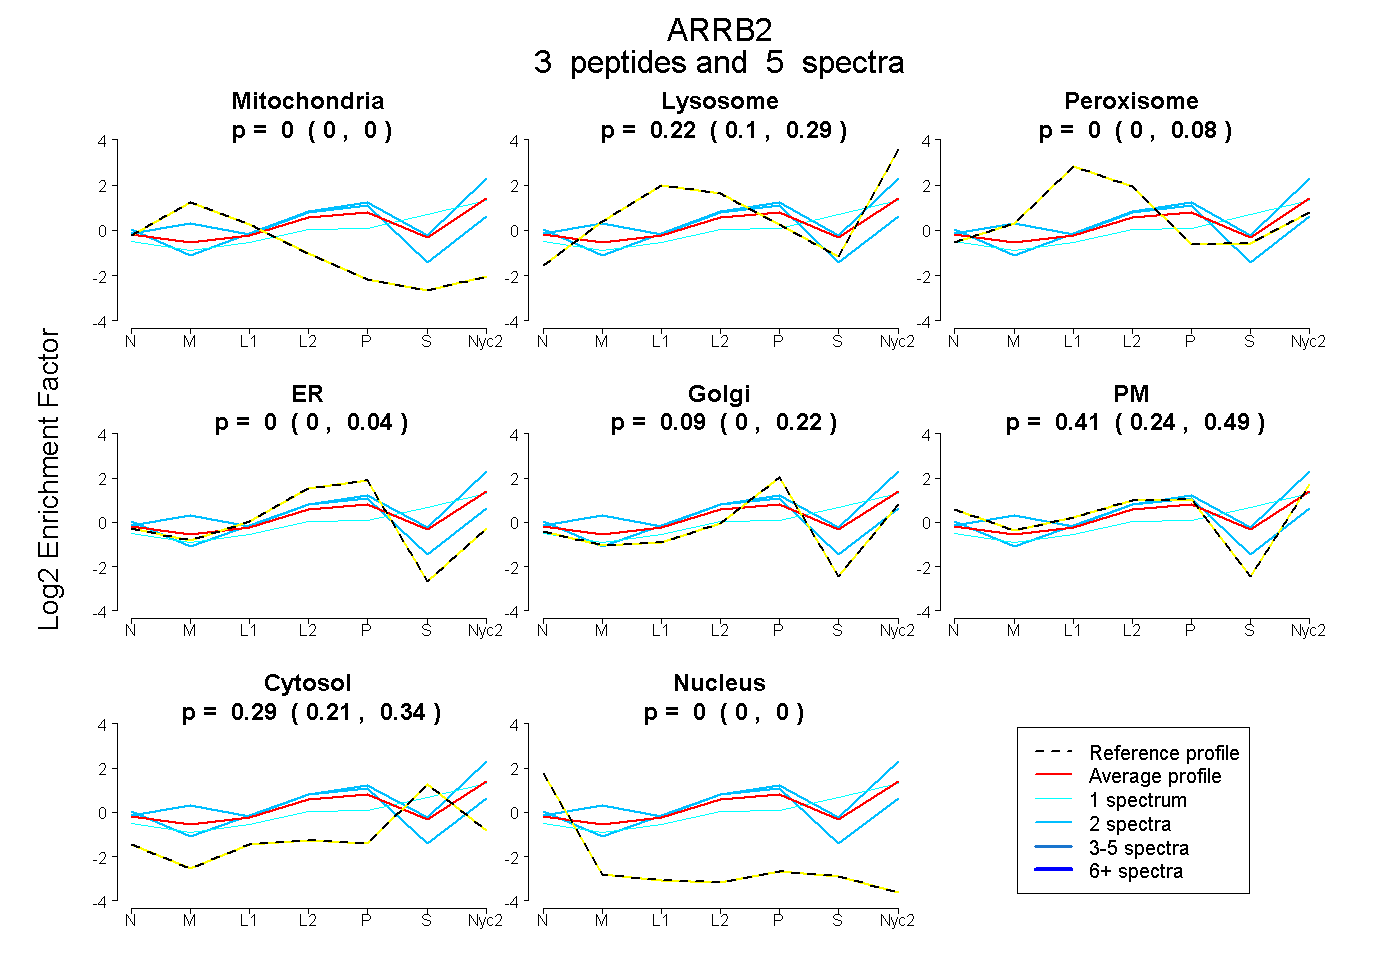
0.000 | 0.000
0.097 | 0.286
0.000 | 0.080
0.000 | 0.037
0.000 | 0.224
0.242 | 0.495
0.207 | 0.342
0.000 | 0.000
| Plot | Mito | Lyso | Perox | ER | Golgi | PM | Cytosol | Nucleus | |||||
| Expt A |
3 peptides |
5 spectra |
|
0.000 0.000 | 0.000 |
0.218 0.097 | 0.286 |
0.000 0.000 | 0.080 |
0.000 0.000 | 0.037 |
0.085 0.000 | 0.224 |
0.411 0.242 | 0.495 |
0.286 0.207 | 0.342 |
0.000 0.000 | 0.000 |
| 2 spectra, DFVDHLDK | 0.000 | 0.287 | 0.000 | 0.000 | 0.120 | 0.381 | 0.211 | 0.000 | ||
| 2 spectra, HFLMSDR | 0.087 | 0.038 | 0.175 | 0.098 | 0.364 | 0.208 | 0.031 | 0.000 | ||
| 1 spectrum, VYTITPLLSDNR | 0.000 | 0.280 | 0.000 | 0.000 | 0.000 | 0.212 | 0.508 | 0.000 |
| Plot | Lyso | Other | |||||||||||
| Expt C |
2 peptides |
4 spectra |
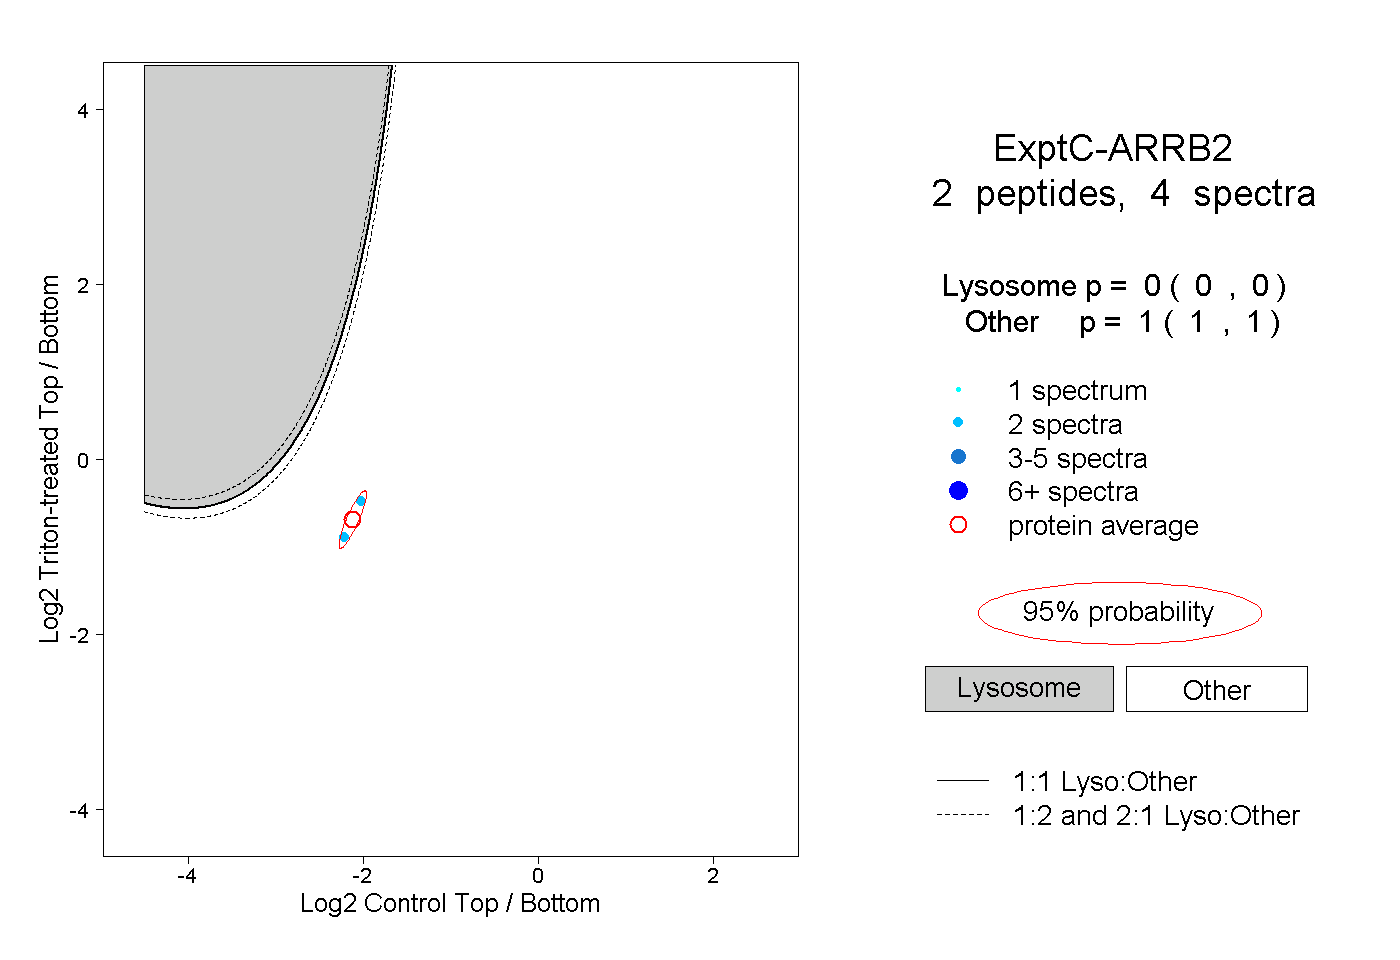 |
0.000 0.000 | 0.000 |
1.000 1.000 | 1.000 |