 6
6peptides
spectra
0.000 | 0.000
0.000 | 0.000
0.000 | 0.000
0.000 | 0.018
0.000 | 0.000
0.000 | 0.000
0.421 | 0.463
0.523 | 0.574
1peptide
spectrum
NA | NA
NA | NA
NA | NA
NA | NA
NA | NA
NA | NA
NA | NA
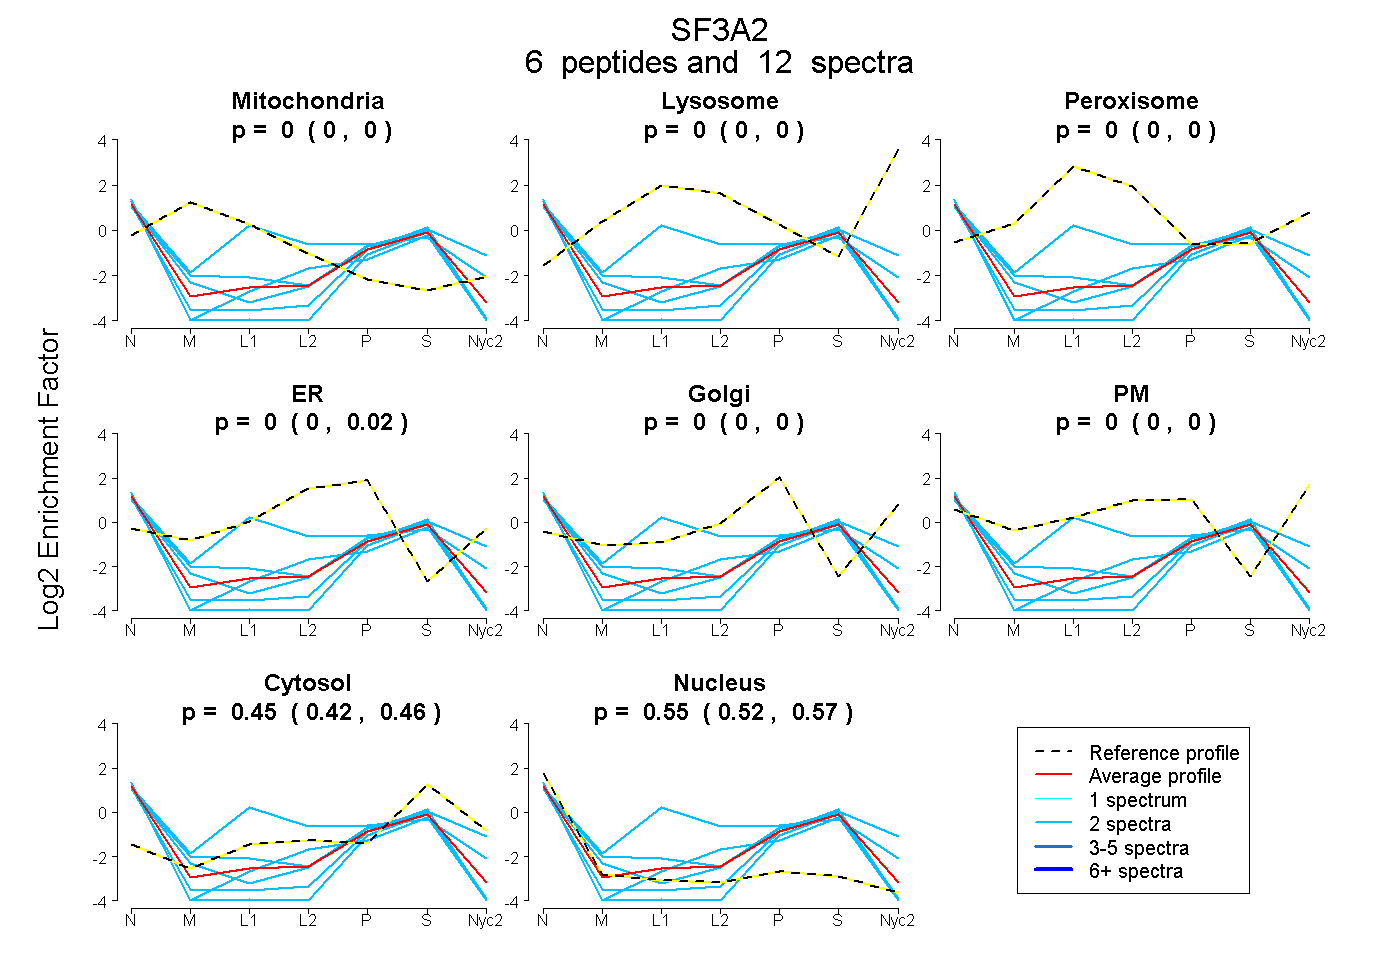
| Plot | Mito | Lyso | Perox | ER | Golgi | PM | Cytosol | Nucleus | |||||
| Expt A |
6 peptides |
12 spectra |
|
0.000 0.000 | 0.000 |
0.000 0.000 | 0.000 |
0.000 0.000 | 0.000 |
0.000 0.000 | 0.018 |
0.000 0.000 | 0.000 |
0.000 0.000 | 0.000 |
0.449 0.421 | 0.463 |
0.551 0.523 | 0.574 |
||
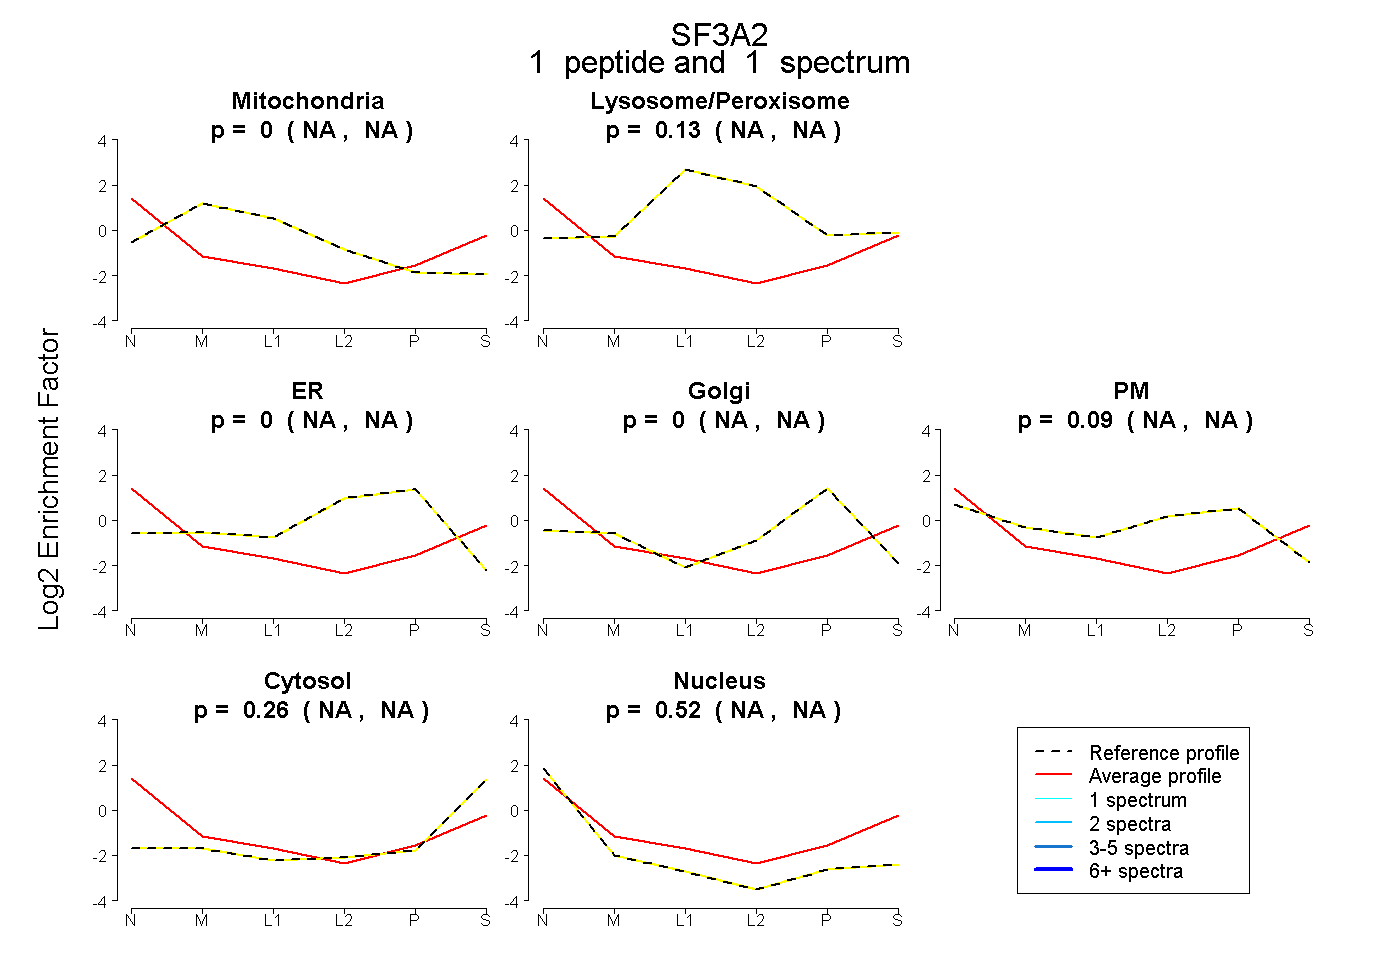
| Plot | Mito | Lyso or Perox | ER | Golgi | PM | Cytosol | Nucleus | ||||||
| Expt B |
1 peptide |
1 spectrum |
|
0.000 NA | NA |
0.131 NA | NA |
0.000 NA | NA |
0.000 NA | NA |
0.086 NA | NA |
0.262 NA | NA |
0.520 NA | NA |