 2
2peptides
spectra
0.000 | 0.000
0.337 | 0.613
0.000 | 0.153
0.000 | 0.000
0.000 | 0.000
0.215 | 0.395
0.096 | 0.207
0.000 | 0.000
4peptides
spectra
0.980 | 1.000
0.000 | 0.019
| Plot | Mito | Lyso | Perox | ER | Golgi | PM | Cytosol | Nucleus | |||||
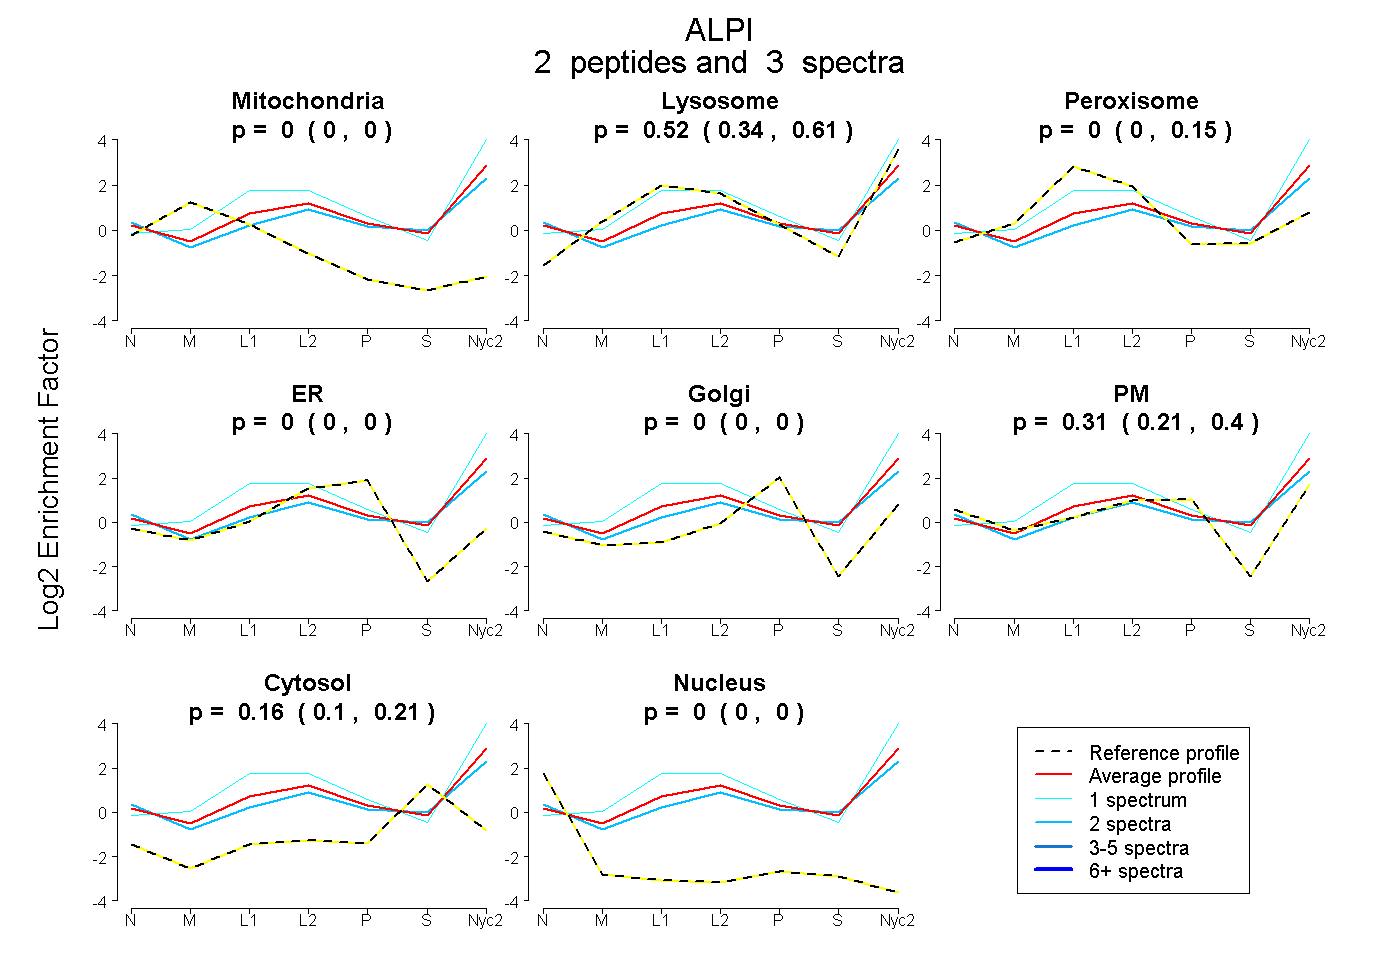
| Expt A |
2 peptides |
3 spectra |
|
0.000 0.000 | 0.000 |
0.521 0.337 | 0.613 |
0.000 0.000 | 0.153 |
0.000 0.000 | 0.000 |
0.000 0.000 | 0.000 |
0.315 0.215 | 0.395 |
0.165 0.096 | 0.207 |
0.000 0.000 | 0.000 |
||
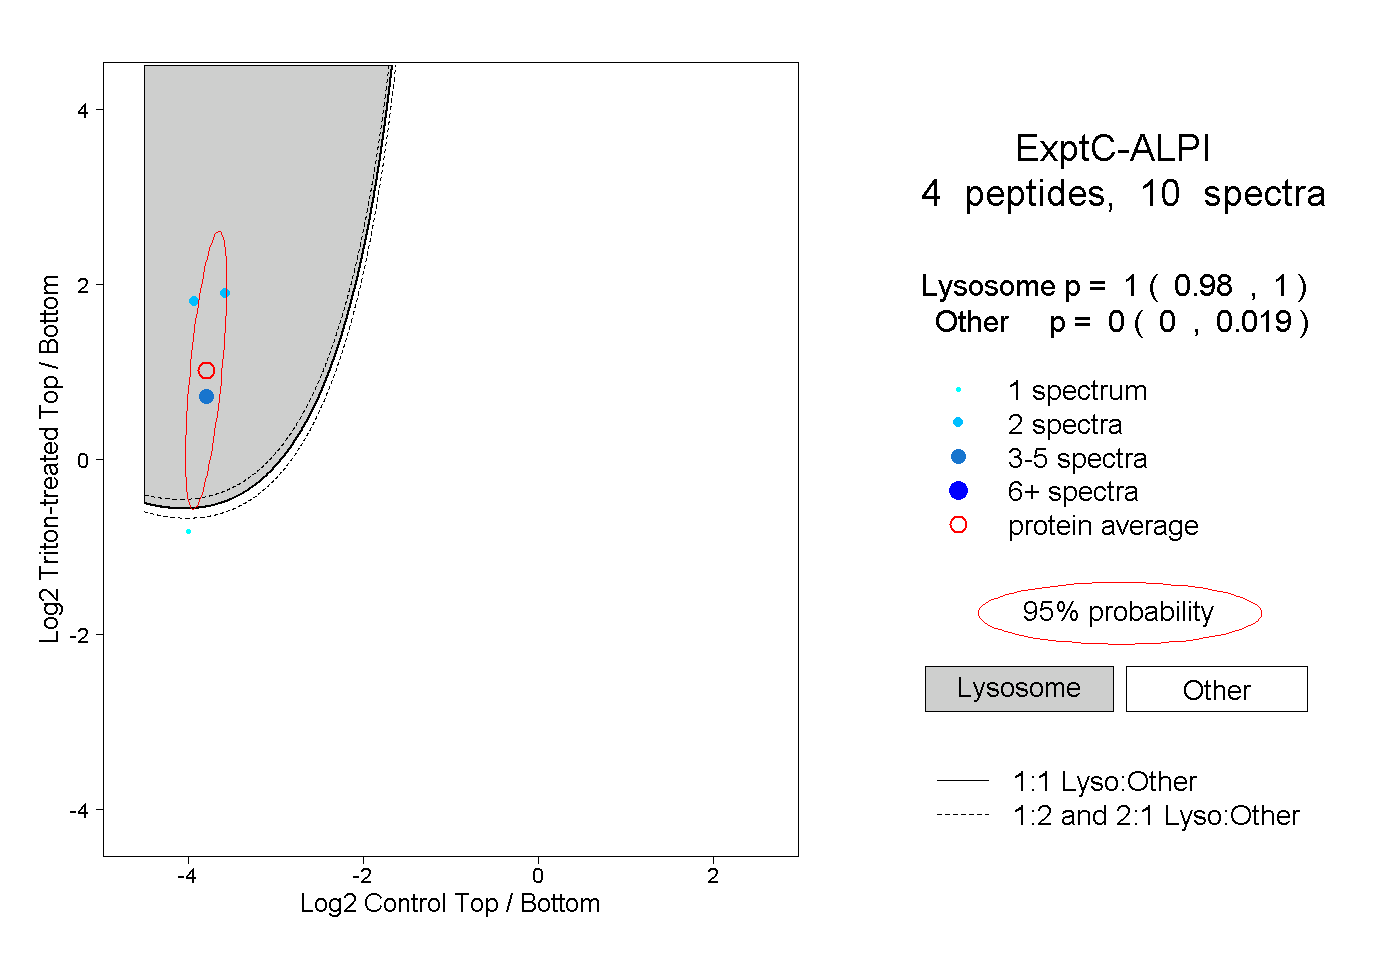
| Plot | Lyso | Other | |||||||||||
| Expt C |
4 peptides |
10 spectra |
|
1.000 0.980 | 1.000 |
0.000 0.000 | 0.019 |
| 1 spectrum, SVGVVTTTR | 0.035 | 0.965 | ||||||||
| 5 spectra, EALDVAK | 1.000 | 0.000 | ||||||||
| 2 spectra, NLVEEWLAK | 1.000 | 0.000 | ||||||||
| 2 spectra, LQPIQTSAK | 1.000 | 0.000 |