 8
8peptides
spectra
0.000 | 0.000
0.000 | 0.000
0.000 | 0.000
0.109 | 0.154
0.000 | 0.000
0.000 | 0.000
0.380 | 0.412
0.440 | 0.491
1peptide
spectrum
NA | NA
NA | NA
NA | NA
NA | NA
NA | NA
NA | NA
NA | NA
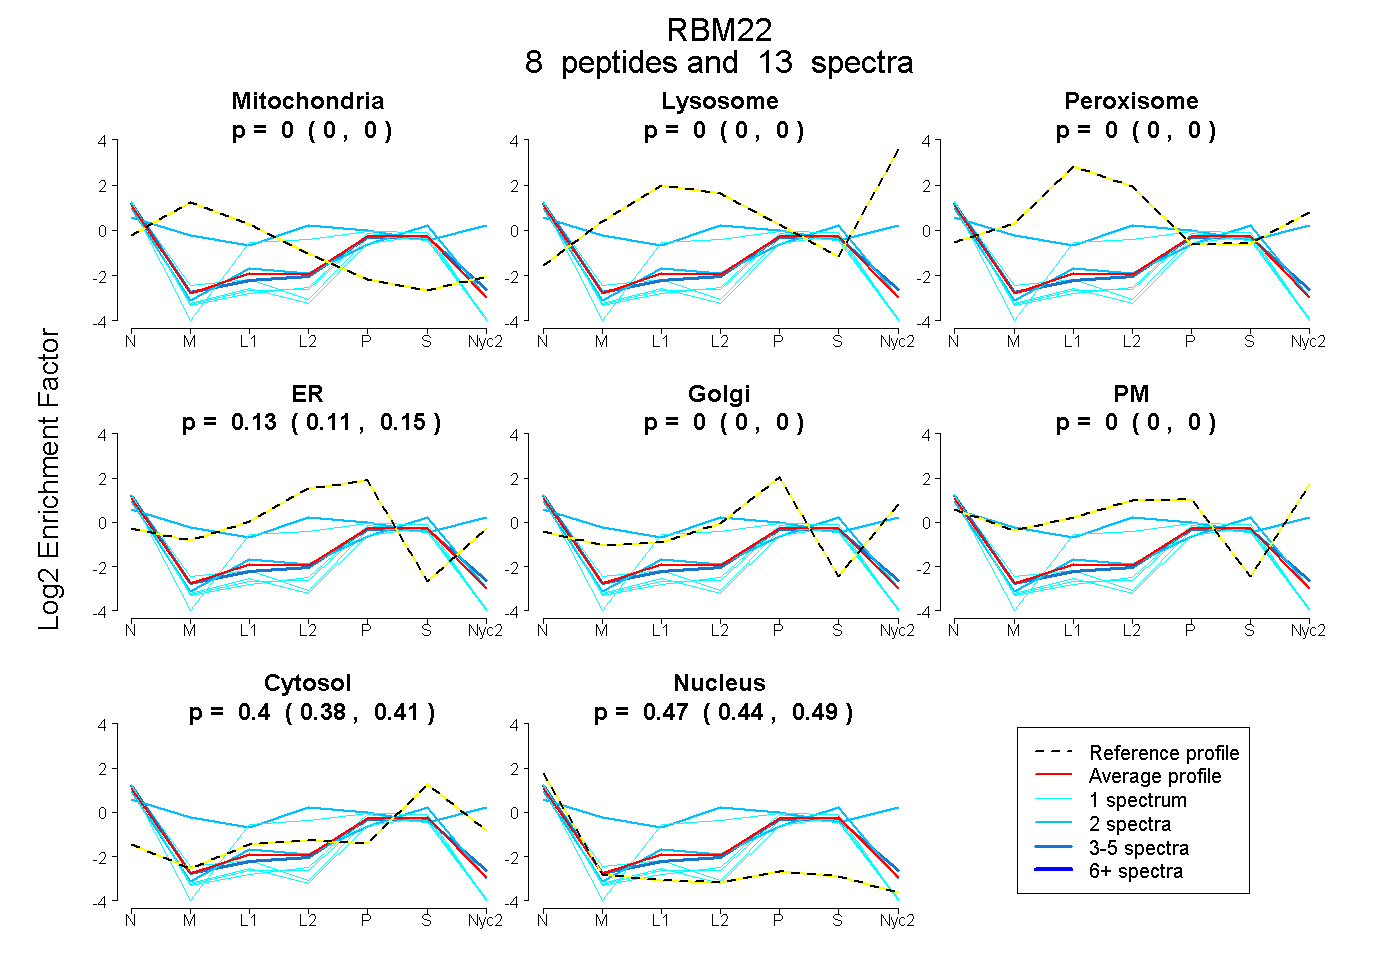
| Plot | Mito | Lyso | Perox | ER | Golgi | PM | Cytosol | Nucleus | |||||
| Expt A |
8 peptides |
13 spectra |
|
0.000 0.000 | 0.000 |
0.000 0.000 | 0.000 |
0.000 0.000 | 0.000 |
0.134 0.109 | 0.154 |
0.000 0.000 | 0.000 |
0.000 0.000 | 0.000 |
0.398 0.380 | 0.412 |
0.468 0.440 | 0.491 |
||
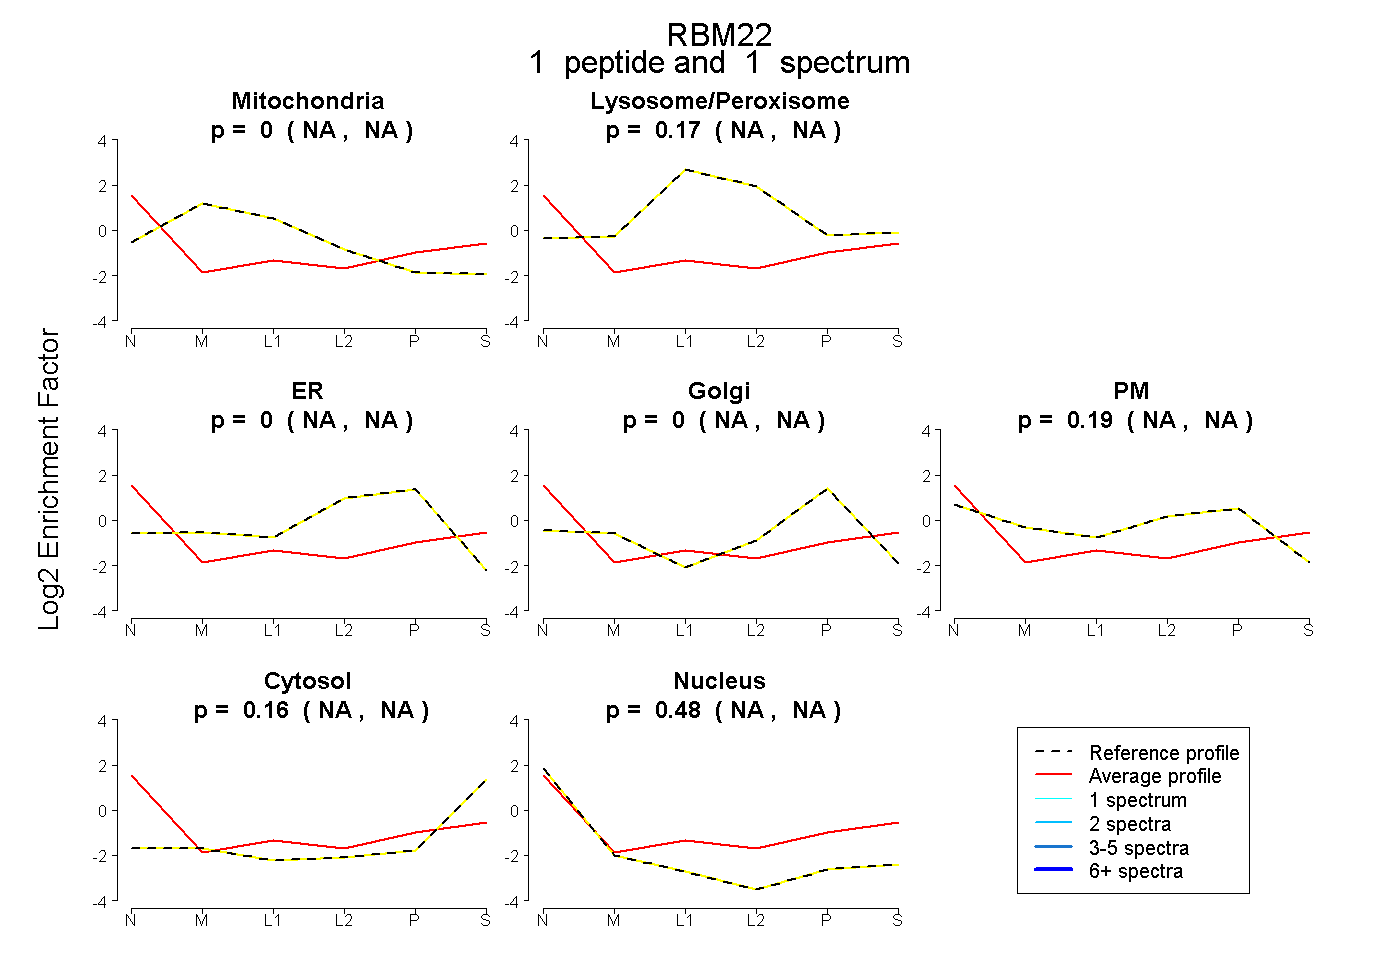
| Plot | Mito | Lyso or Perox | ER | Golgi | PM | Cytosol | Nucleus | ||||||
| Expt B |
1 peptide |
1 spectrum |
|
0.000 NA | NA |
0.169 NA | NA |
0.000 NA | NA |
0.000 NA | NA |
0.190 NA | NA |
0.160 NA | NA |
0.481 NA | NA |