AMPD2
[ENSRNOP00000026051]
Main page
| | | Plot |
Mito |
Lyso |
|
Perox |
ER |
Golgi |
PM |
Cytosol |
Nucleus |
|
| Expt A |
 20
20
peptides |
63
spectra |
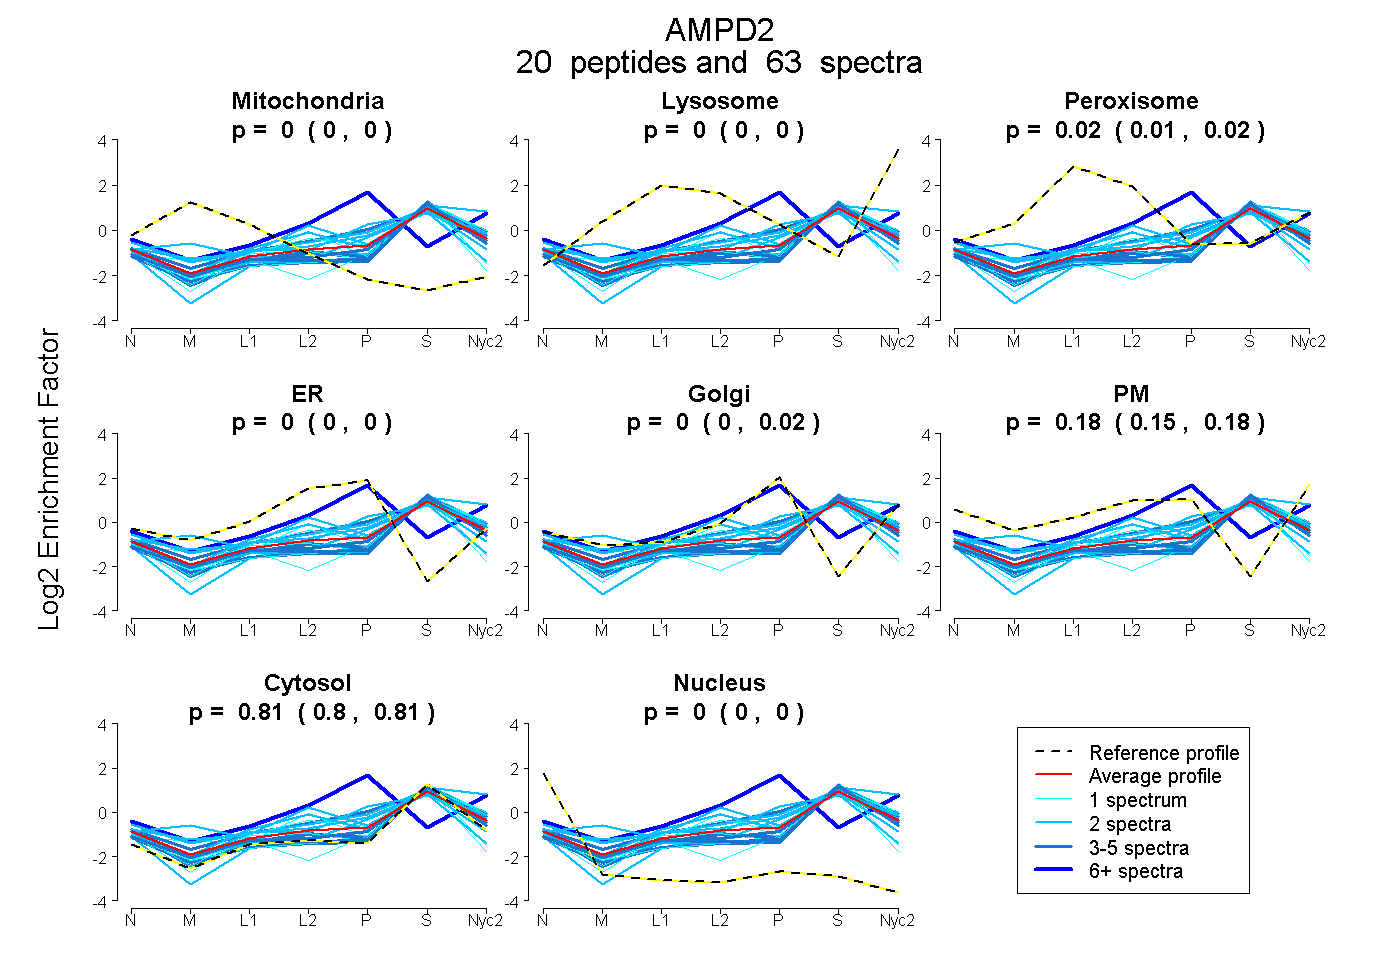 |
0.000
0.000 | 0.000 |
0.000
0.000 | 0.000 |
|
0.015
0.010 | 0.023 |
0.000
0.000 | 0.000 |
0.001
0.000 | 0.019 |
0.176
0.154 | 0.181 |
0.808
0.800 | 0.812 |
0.000
0.000 | 0.000 |
|
| | | Plot |
Mito |
|
Lyso or Perox |
|
ER |
Golgi |
PM |
Cytosol |
Nucleus |
|
| Expt B |
11
peptides |
18
spectra |
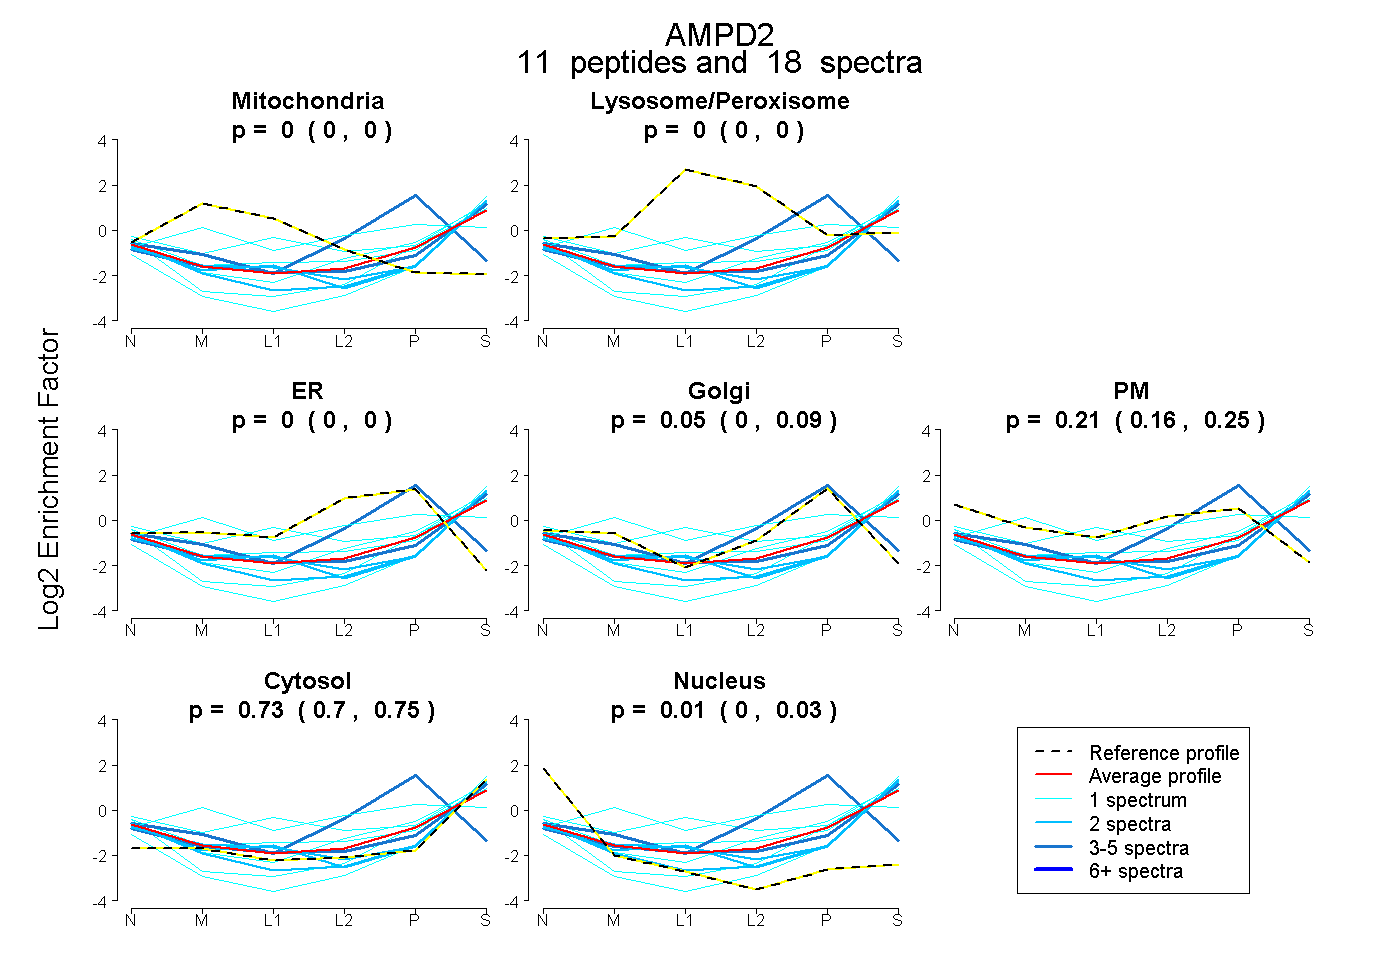 |
0.000
0.000 | 0.000 |
|
0.000
0.000 | 0.000 |
|
0.000
0.000 | 0.000 |
0.048
0.000 | 0.094 |
0.213
0.163 | 0.250 |
0.729
0.705 | 0.749 |
0.010
0.000 | 0.028 |
|
| | | Plot |
|
Lyso |
|
|
|
|
|
|
|
Other |
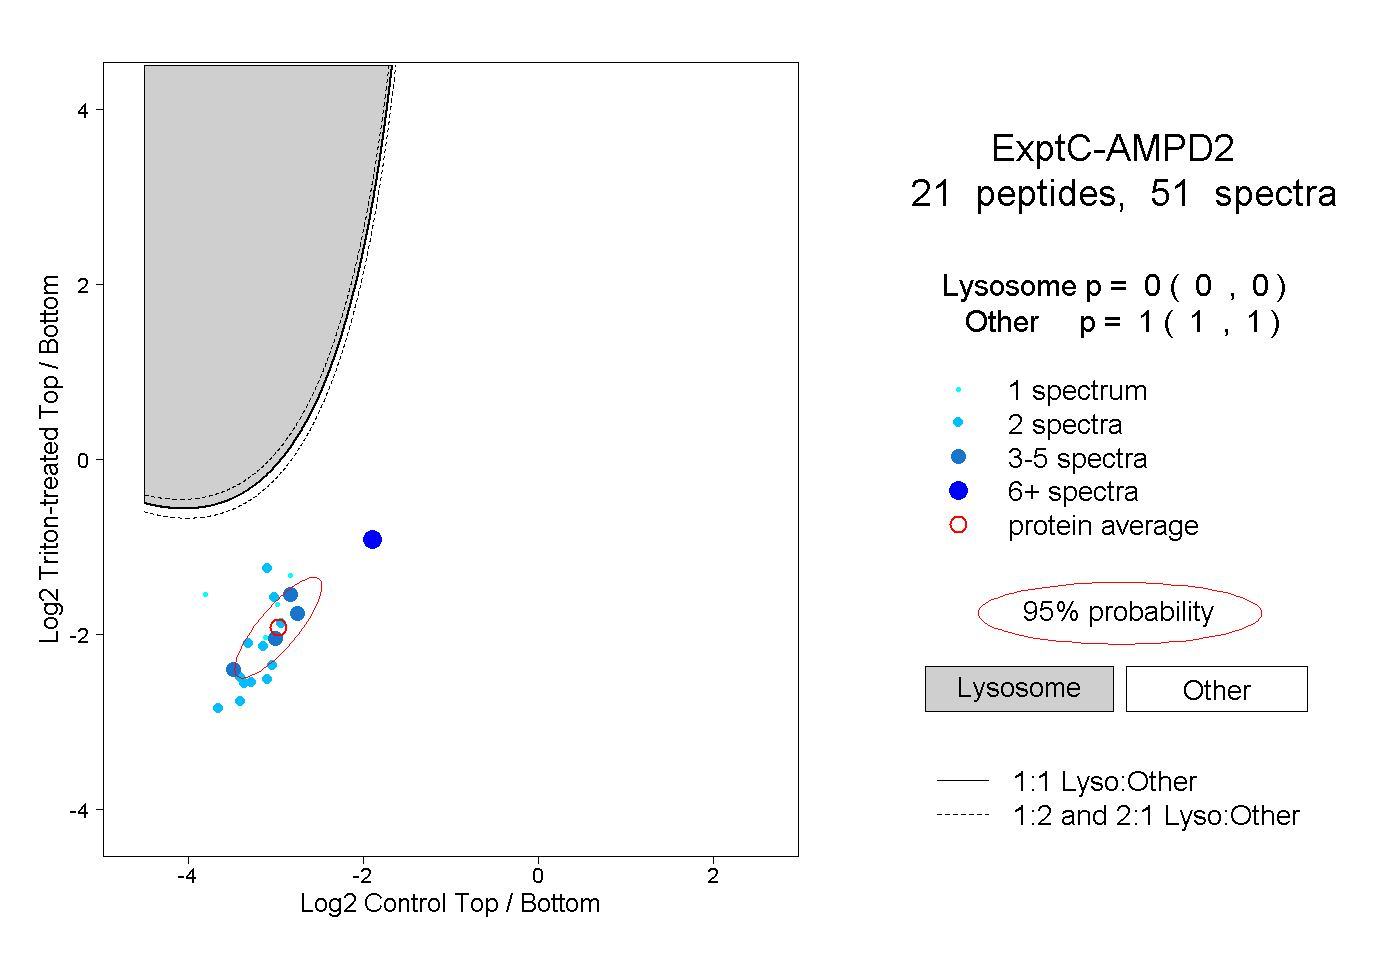
| Expt C |
21
peptides |
51
spectra |
 |
|
0.000
0.000 | 0.000 |
|
|
|
|
|
|
|
1.000
1.000 | 1.000 |
| 2 spectra, GVVHVYTR |
|
0.000 |
|
|
|
|
|
|
|
1.000 |
| 2 spectra, LSSCDMCELAR |
|
0.000 |
|
|
|
|
|
|
|
1.000 |
| 2 spectra, SLAESELR |
|
0.000 |
|
|
|
|
|
|
|
1.000 |
| 2 spectra, DVVLER |
|
0.000 |
|
|
|
|
|
|
|
1.000 |
| 2 spectra, LQYLSSK |
|
0.000 |
|
|
|
|
|
|
|
1.000 |
| 2 spectra, EIAEELFSR |
|
0.000 |
|
|
|
|
|
|
|
1.000 |
| 5 spectra, WLVQVPR |
|
0.000 |
|
|
|
|
|
|
|
1.000 |
| 1 spectrum, YNPIGESVLR |
|
0.000 |
|
|
|
|
|
|
|
1.000 |
| 1 spectrum, VIISGEEK |
|
0.000 |
|
|
|
|
|
|
|
1.000 |
| 2 spectra, SLPGTAPCLK |
|
0.000 |
|
|
|
|
|
|
|
1.000 |
| 8 spectra, HFPLDLR |
|
0.000 |
|
|
|
|
|
|
|
1.000 |
| 3 spectra, SGLGASPLQSAR |
|
0.000 |
|
|
|
|
|
|
|
1.000 |
| 2 spectra, YLQQLAEKPLETR |
|
0.000 |
|
|
|
|
|
|
|
1.000 |
| 2 spectra, EGPEGNDIR |
|
0.000 |
|
|
|
|
|
|
|
1.000 |
| 2 spectra, TNVPDIR |
|
0.000 |
|
|
|
|
|
|
|
1.000 |
| 2 spectra, YQNAELR |
|
0.000 |
|
|
|
|
|
|
|
1.000 |
| 1 spectrum, VHSPNVR |
|
0.000 |
|
|
|
|
|
|
|
1.000 |
| 2 spectra, LEPDILLR |
|
0.000 |
|
|
|
|
|
|
|
1.000 |
| 1 spectrum, ELAAQK |
|
0.000 |
|
|
|
|
|
|
|
1.000 |
| 4 spectra, YFAHIIK |
|
0.000 |
|
|
|
|
|
|
|
1.000 |
| 3 spectra, EVMSDLEESK |
|
0.000 |
|
|
|
|
|
|
|
1.000 |