 20
20peptides
spectra
0.000 | 0.000
0.000 | 0.000
0.010 | 0.023
0.000 | 0.000
0.000 | 0.019
0.154 | 0.181
0.800 | 0.812
0.000 | 0.000
| Plot | Mito | Lyso | Perox | ER | Golgi | PM | Cytosol | Nucleus | |||||
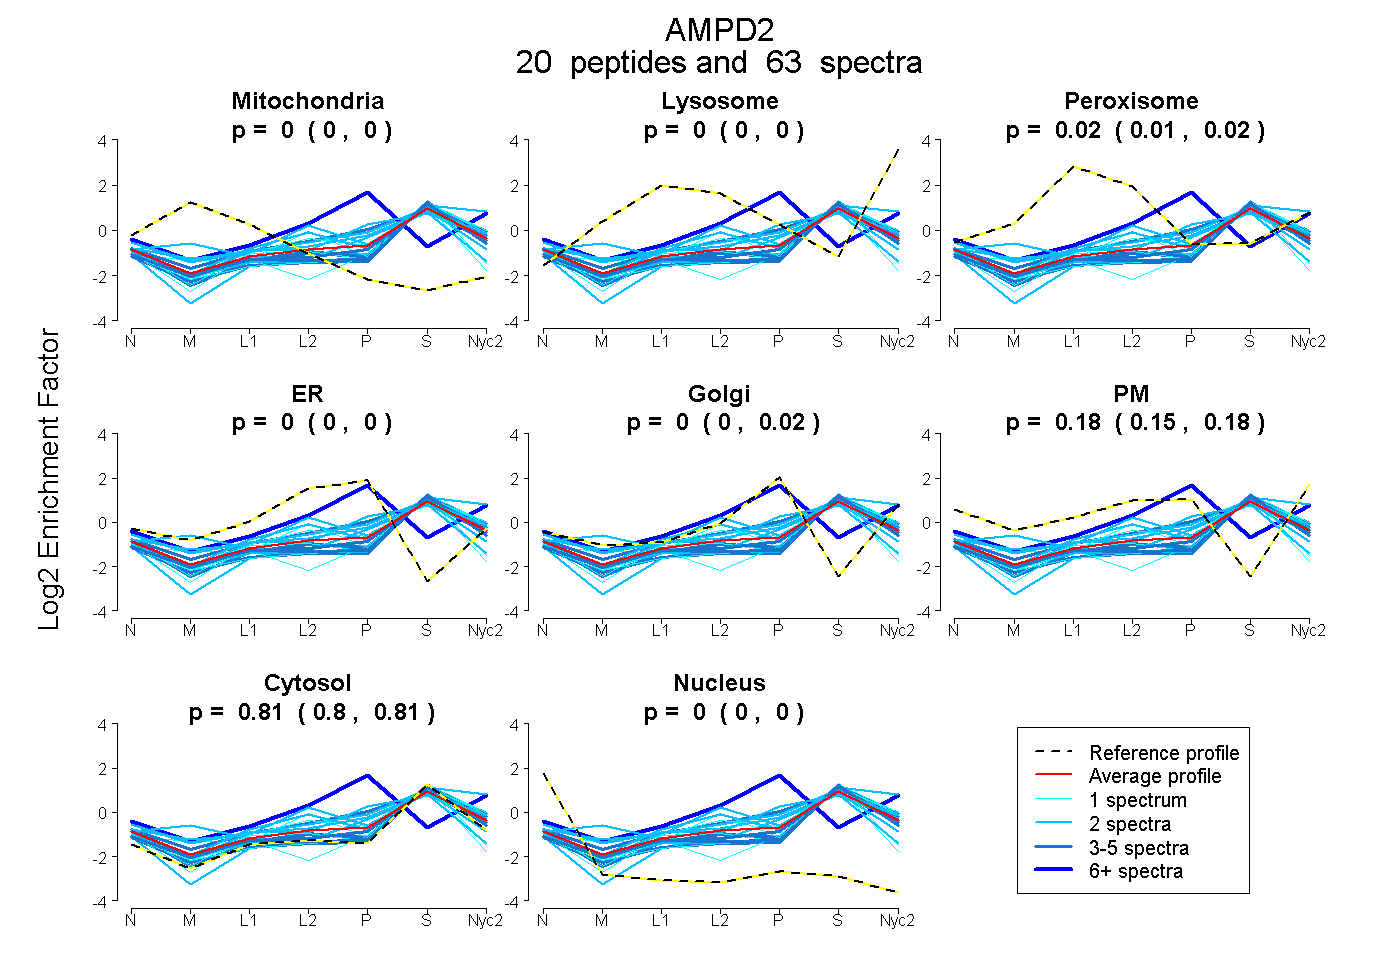
| Expt A |
20 peptides |
63 spectra |
|
0.000 0.000 | 0.000 |
0.000 0.000 | 0.000 |
0.015 0.010 | 0.023 |
0.000 0.000 | 0.000 |
0.001 0.000 | 0.019 |
0.176 0.154 | 0.181 |
0.808 0.800 | 0.812 |
0.000 0.000 | 0.000 |
| 2 spectra, GVVHVYTR | 0.000 | 0.052 | 0.049 | 0.000 | 0.183 | 0.002 | 0.714 | 0.000 | ||
| 1 spectrum, LSSCDMCELAR | 0.024 | 0.000 | 0.000 | 0.000 | 0.000 | 0.000 | 0.912 | 0.064 | ||
| 2 spectra, DVVLER | 0.000 | 0.000 | 0.000 | 0.000 | 0.035 | 0.000 | 0.965 | 0.000 | ||
| 2 spectra, LQYLSSK | 0.000 | 0.000 | 0.087 | 0.000 | 0.293 | 0.000 | 0.620 | 0.000 | ||
| 5 spectra, EIAEELFSR | 0.000 | 0.000 | 0.000 | 0.000 | 0.000 | 0.032 | 0.953 | 0.015 | ||
| 5 spectra, YNPIGESVLR | 0.039 | 0.027 | 0.000 | 0.000 | 0.000 | 0.025 | 0.910 | 0.000 | ||
| 2 spectra, WAVNHR | 0.000 | 0.247 | 0.000 | 0.000 | 0.000 | 0.046 | 0.707 | 0.000 | ||
| 18 spectra, HFPLDLR | 0.000 | 0.111 | 0.000 | 0.114 | 0.546 | 0.000 | 0.229 | 0.000 | ||
| 1 spectrum, TDSDSDLQLYK | 0.000 | 0.090 | 0.000 | 0.000 | 0.000 | 0.011 | 0.899 | 0.000 | ||
| 3 spectra, EGPEGNDIR | 0.000 | 0.009 | 0.000 | 0.000 | 0.000 | 0.093 | 0.898 | 0.000 | ||
| 1 spectrum, TNVPDIR | 0.000 | 0.040 | 0.058 | 0.000 | 0.000 | 0.094 | 0.808 | 0.000 | ||
| 2 spectra, HLEEIVHVEQGR | 0.000 | 0.000 | 0.154 | 0.169 | 0.000 | 0.000 | 0.677 | 0.000 | ||
| 2 spectra, SFCYR | 0.219 | 0.000 | 0.000 | 0.000 | 0.124 | 0.000 | 0.657 | 0.000 | ||
| 1 spectrum, SHWLGPNYTK | 0.000 | 0.060 | 0.005 | 0.000 | 0.000 | 0.137 | 0.798 | 0.000 | ||
| 2 spectra, YQNAELR | 0.000 | 0.000 | 0.061 | 0.000 | 0.061 | 0.188 | 0.691 | 0.000 | ||
| 4 spectra, LFDVYR | 0.000 | 0.056 | 0.000 | 0.000 | 0.000 | 0.083 | 0.861 | 0.000 | ||
| 2 spectra, NPLPEYLSR | 0.000 | 0.025 | 0.000 | 0.000 | 0.000 | 0.056 | 0.911 | 0.007 | ||
| 1 spectrum, EPLMEEYSIATQVWK | 0.158 | 0.000 | 0.000 | 0.000 | 0.000 | 0.000 | 0.803 | 0.039 | ||
| 4 spectra, YFAHIIK | 0.000 | 0.000 | 0.000 | 0.000 | 0.000 | 0.136 | 0.864 | 0.000 | ||
| 3 spectra, EVMSDLEESK | 0.000 | 0.000 | 0.086 | 0.078 | 0.161 | 0.000 | 0.676 | 0.000 |
| Plot | Mito | Lyso or Perox | ER | Golgi | PM | Cytosol | Nucleus | ||||||
| Expt B |
11 peptides |
18 spectra |
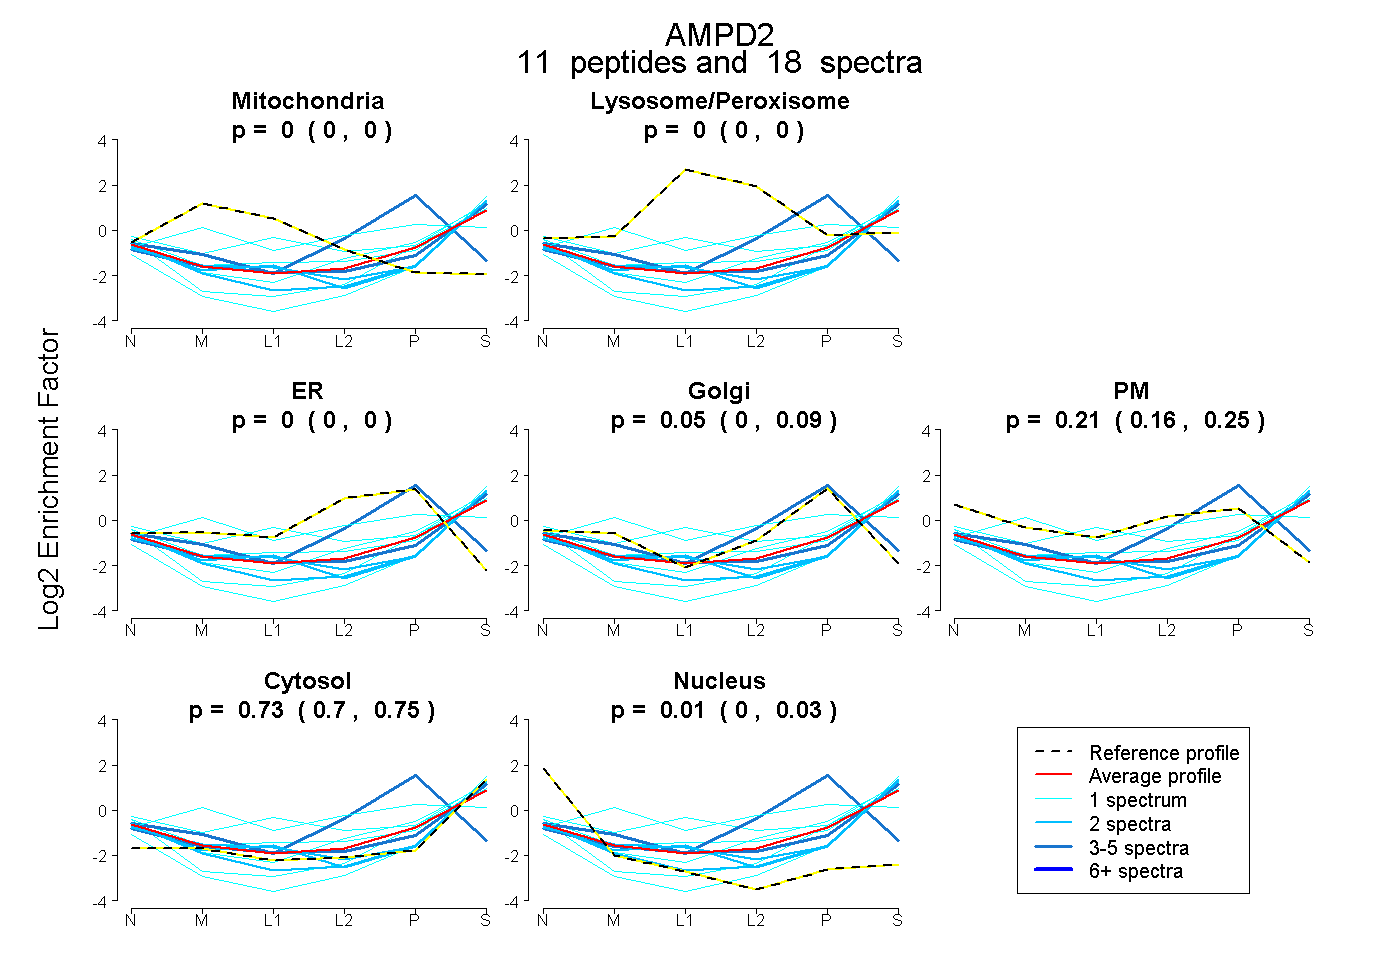 |
0.000 0.000 | 0.000 |
0.000 0.000 | 0.000 |
0.000 0.000 | 0.000 |
0.048 0.000 | 0.094 |
0.213 0.163 | 0.250 |
0.729 0.705 | 0.749 |
0.010 0.000 | 0.028 |
|||
| Plot | Lyso | Other | |||||||||||
| Expt C |
21 peptides |
51 spectra |
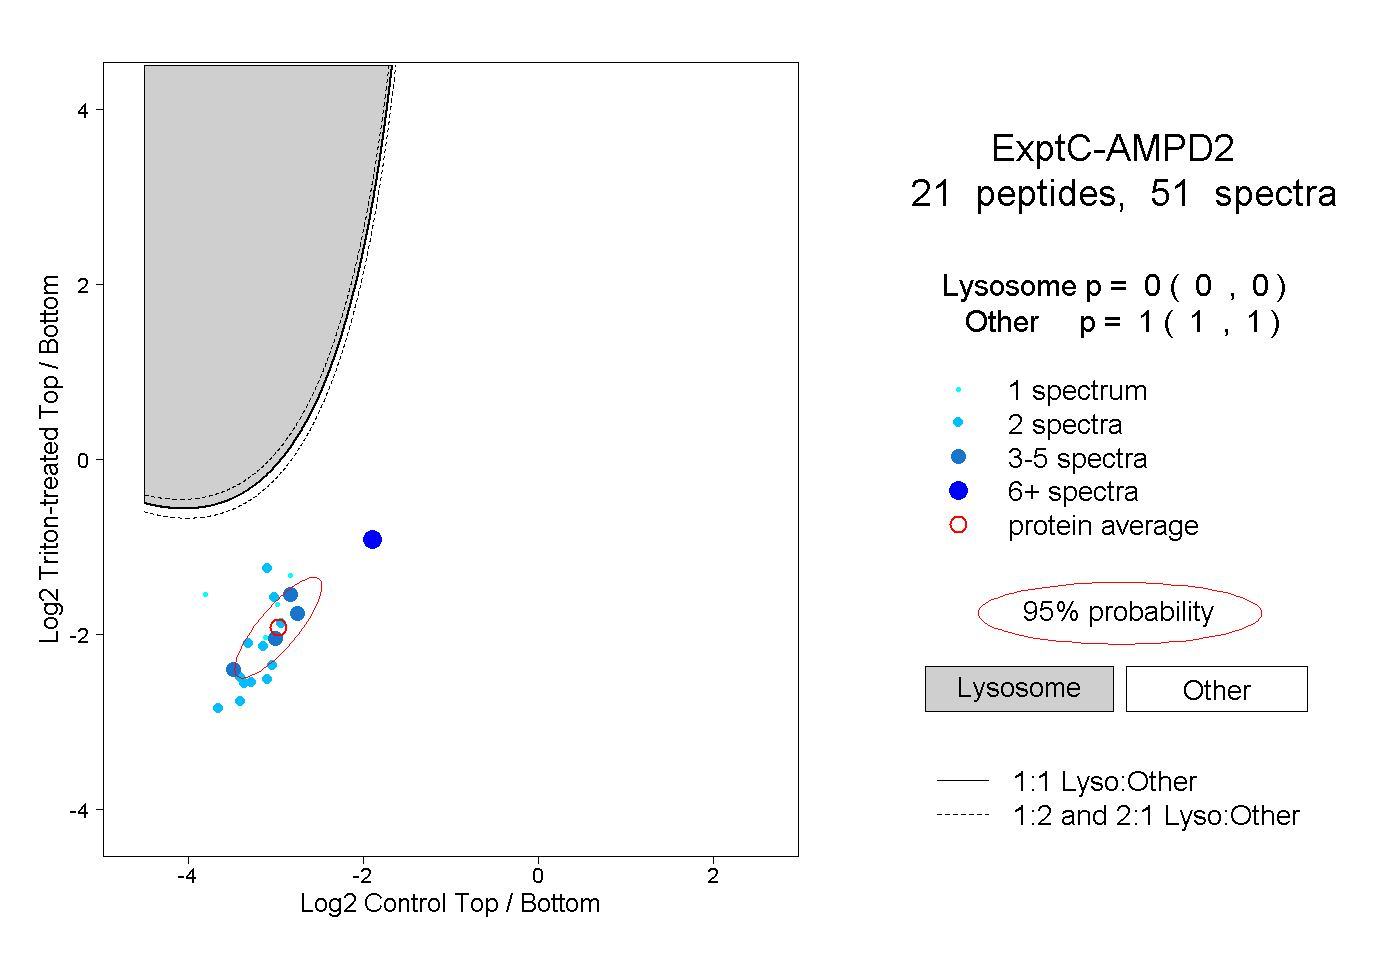 |
0.000 0.000 | 0.000 |
1.000 1.000 | 1.000 |