 3
3peptides
spectra
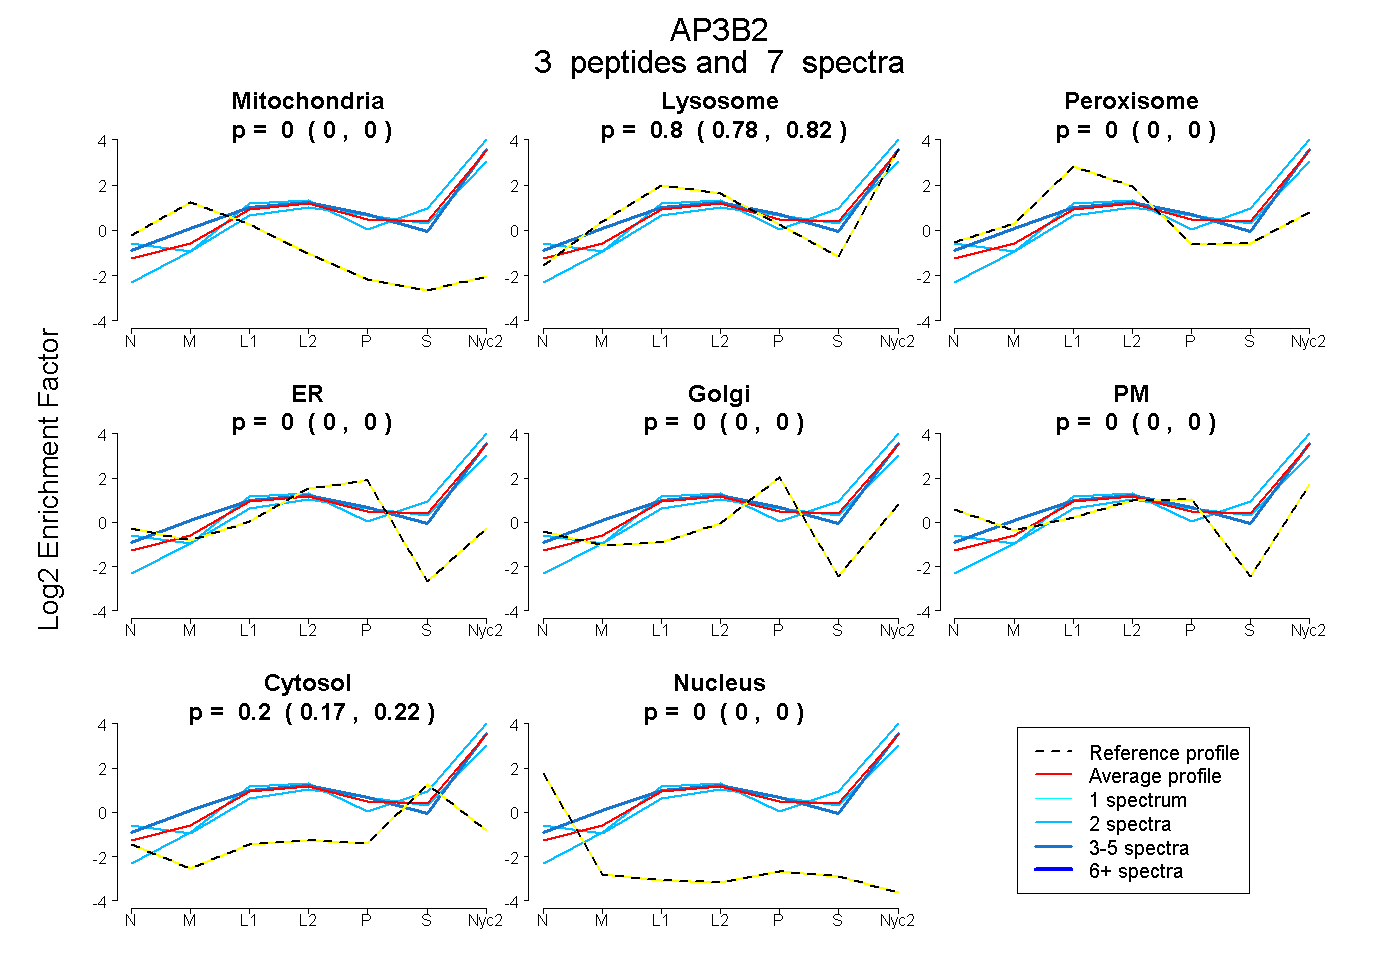
0.000 | 0.000
0.777 | 0.821
0.000 | 0.000
0.000 | 0.000
0.000 | 0.000
0.000 | 0.000
0.174 | 0.219
0.000 | 0.000
2peptides
spectra
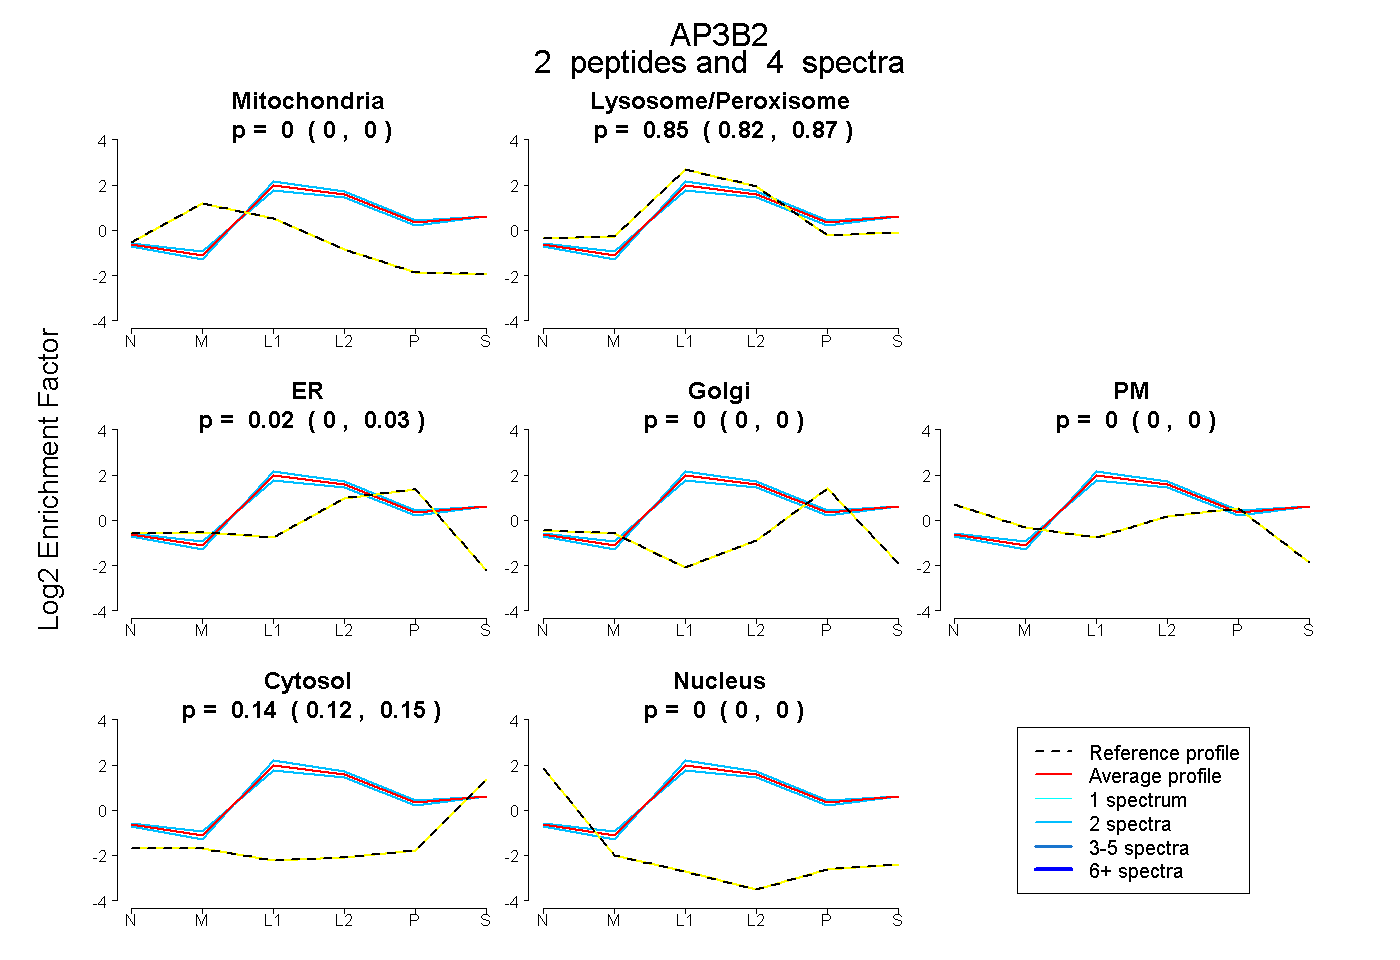
0.000 | 0.000
0.822 | 0.867
0.000 | 0.034
0.000 | 0.000
0.000 | 0.000
0.124 | 0.146
0.000 | 0.000
4peptides
spectra
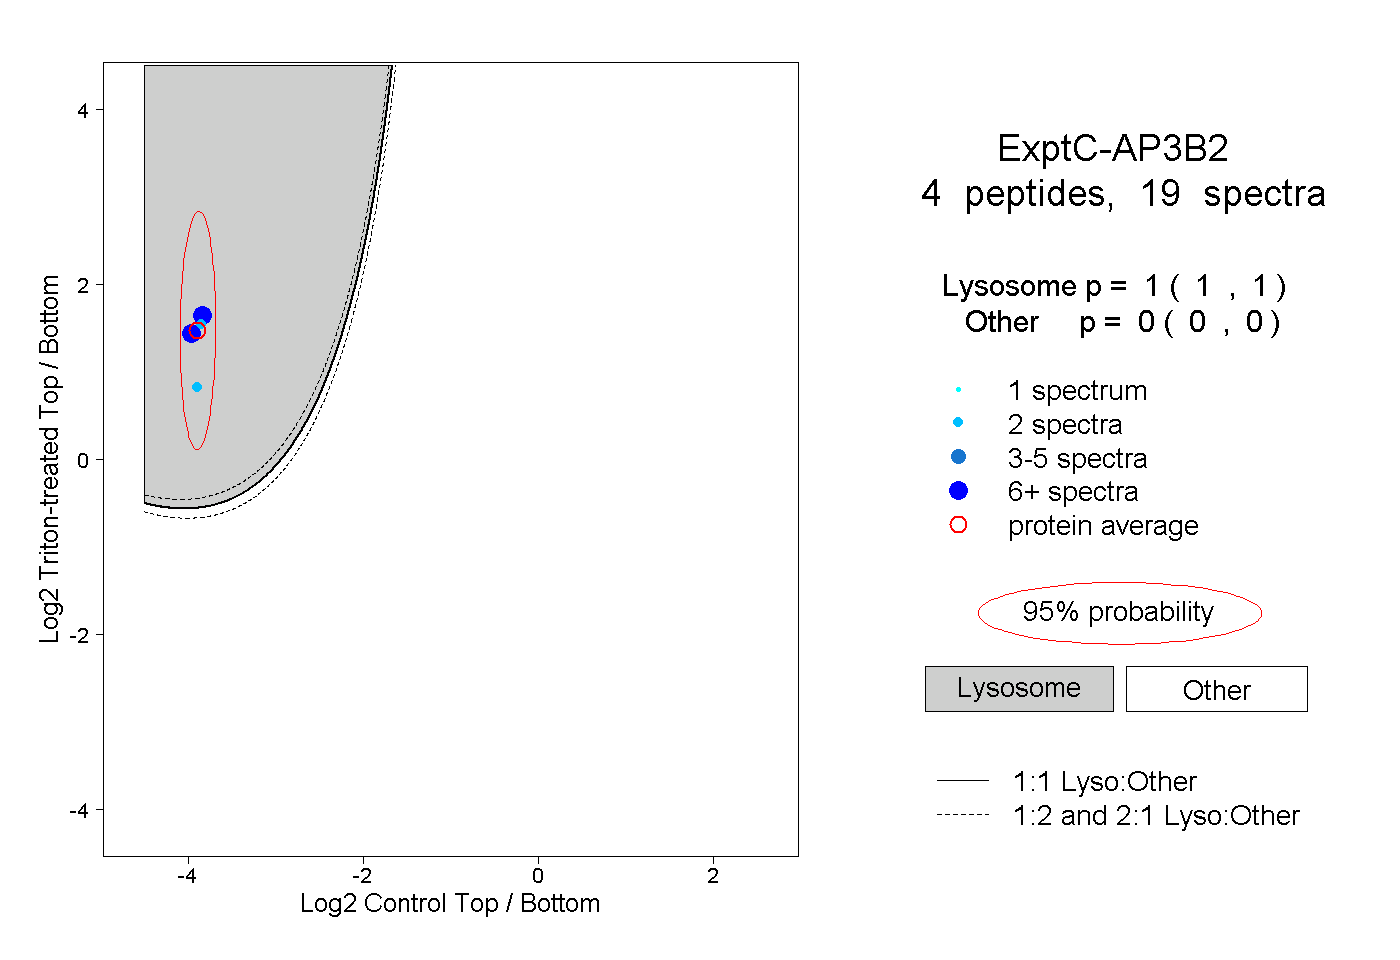
1.000 | 1.000
0.000 | 0.000
1peptide
spectrum
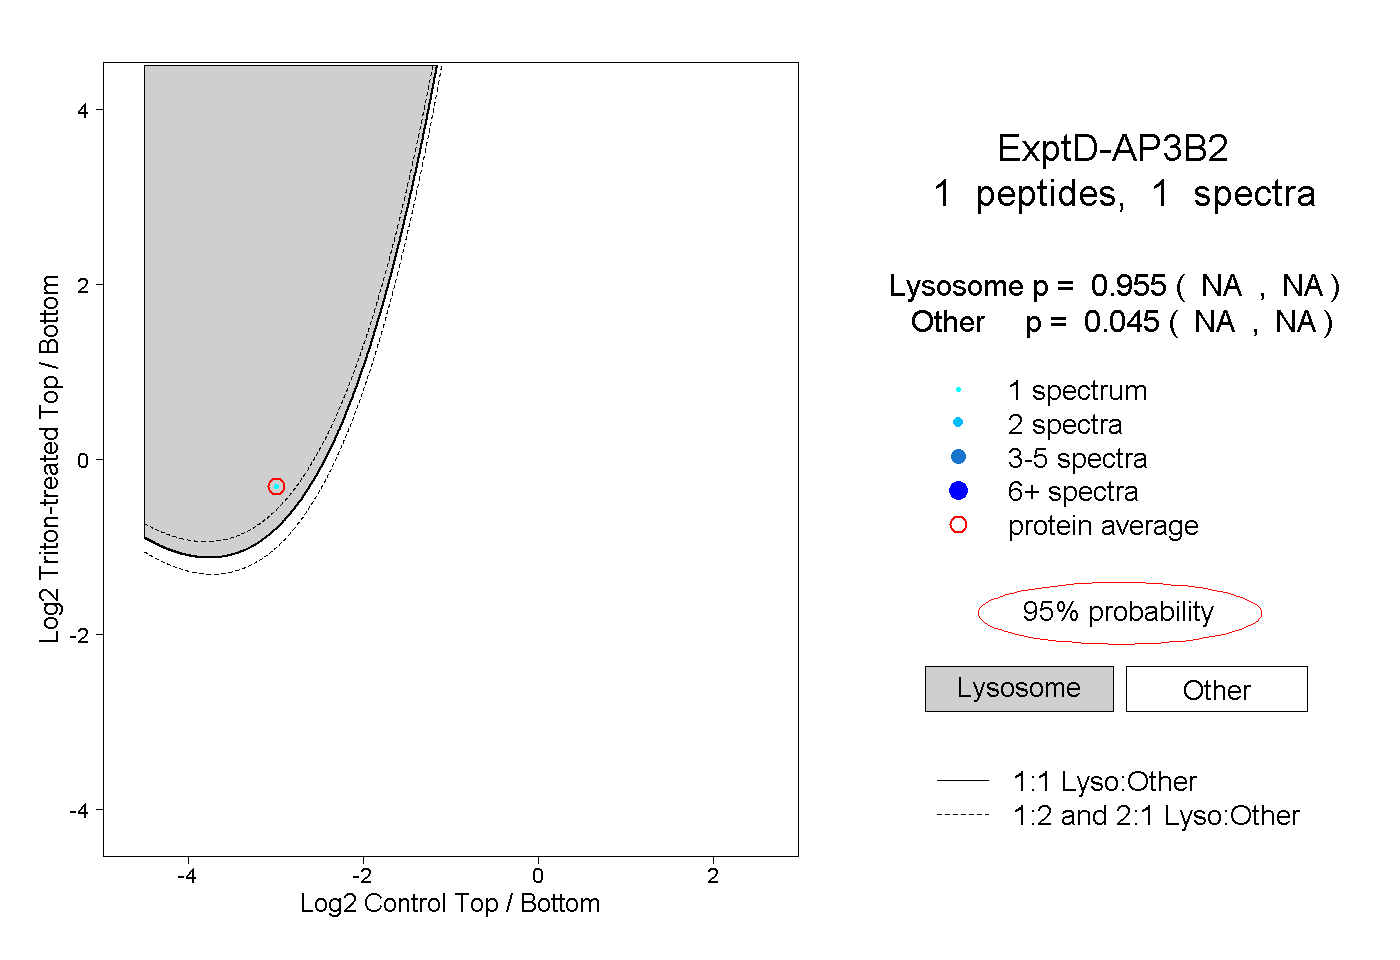
NA | NA
NA | NA