 6
6peptides
spectra
0.000 | 0.000
0.000 | 0.000
0.000 | 0.000
0.826 | 0.934
0.000 | 0.121
0.000 | 0.000
0.000 | 0.000
0.037 | 0.071
| Plot | Mito | Lyso | Perox | ER | Golgi | PM | Cytosol | Nucleus | |||||
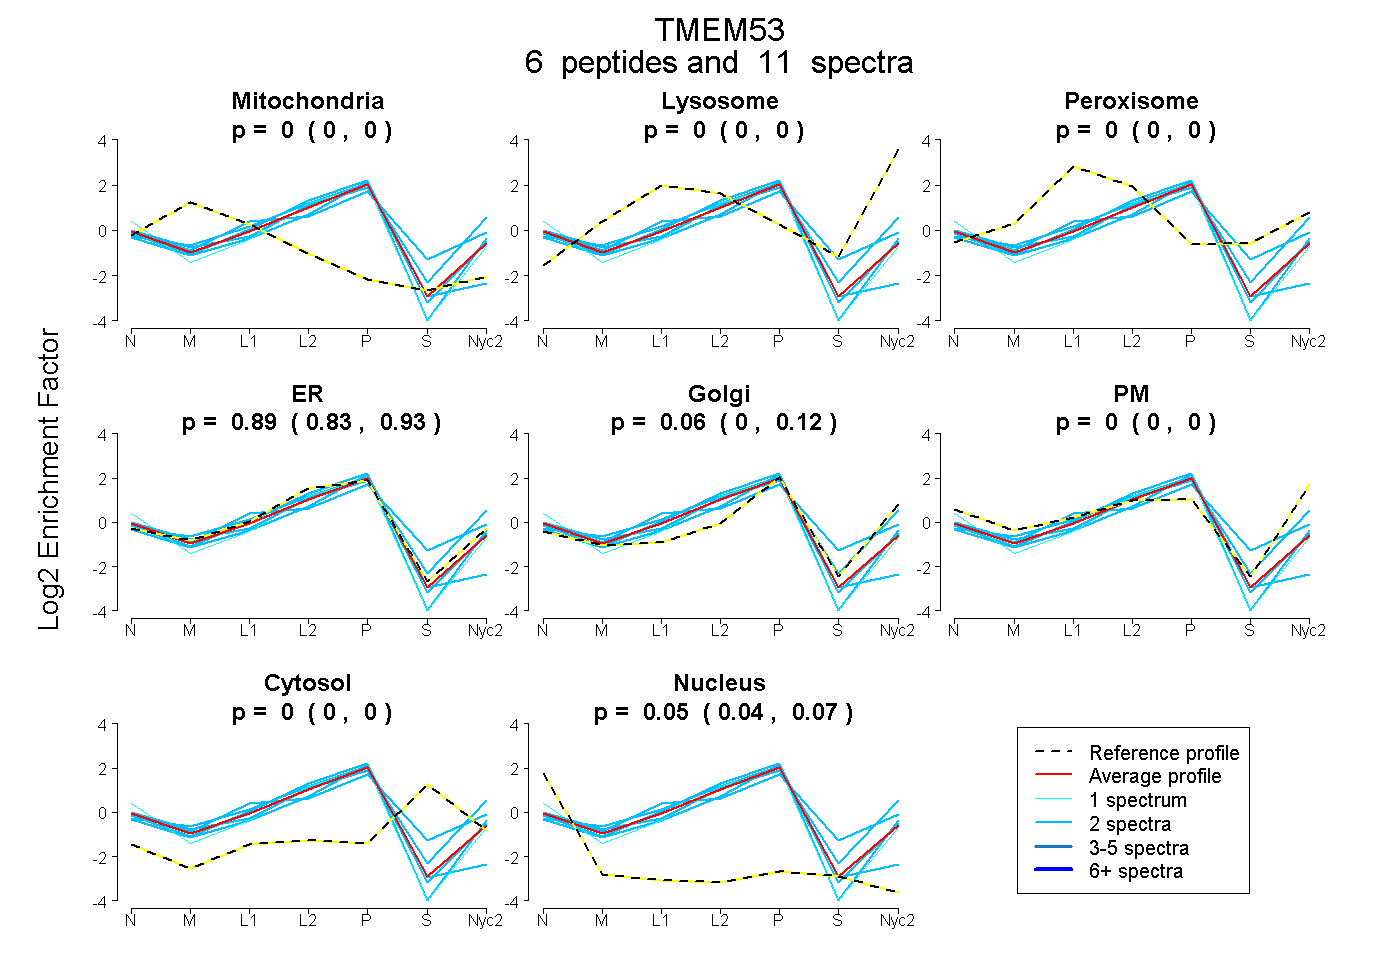
| Expt A |
6 peptides |
11 spectra |
|
0.000 0.000 | 0.000 |
0.000 0.000 | 0.000 |
0.000 0.000 | 0.000 |
0.890 0.826 | 0.934 |
0.055 0.000 | 0.121 |
0.000 0.000 | 0.000 |
0.000 0.000 | 0.000 |
0.055 0.037 | 0.071 |
| 2 spectra, LAHQVSVR | 0.032 | 0.000 | 0.000 | 0.944 | 0.020 | 0.000 | 0.000 | 0.003 | ||
| 2 spectra, GCIVIR | 0.000 | 0.000 | 0.000 | 0.839 | 0.000 | 0.000 | 0.000 | 0.161 | ||
| 1 spectrum, NSQGGK | 0.000 | 0.000 | 0.000 | 0.902 | 0.000 | 0.000 | 0.000 | 0.098 | ||
| 2 spectra, YVLELLQTHQR | 0.000 | 0.000 | 0.000 | 0.475 | 0.274 | 0.247 | 0.003 | 0.000 | ||
| 2 spectra, ALATILER | 0.000 | 0.000 | 0.000 | 0.981 | 0.000 | 0.000 | 0.000 | 0.019 | ||
| 2 spectra, RPAVLR | 0.000 | 0.000 | 0.172 | 0.444 | 0.273 | 0.000 | 0.111 | 0.000 |
| Plot | Mito | Lyso or Perox | ER | Golgi | PM | Cytosol | Nucleus | ||||||
| Expt B |
3 peptides |
8 spectra |
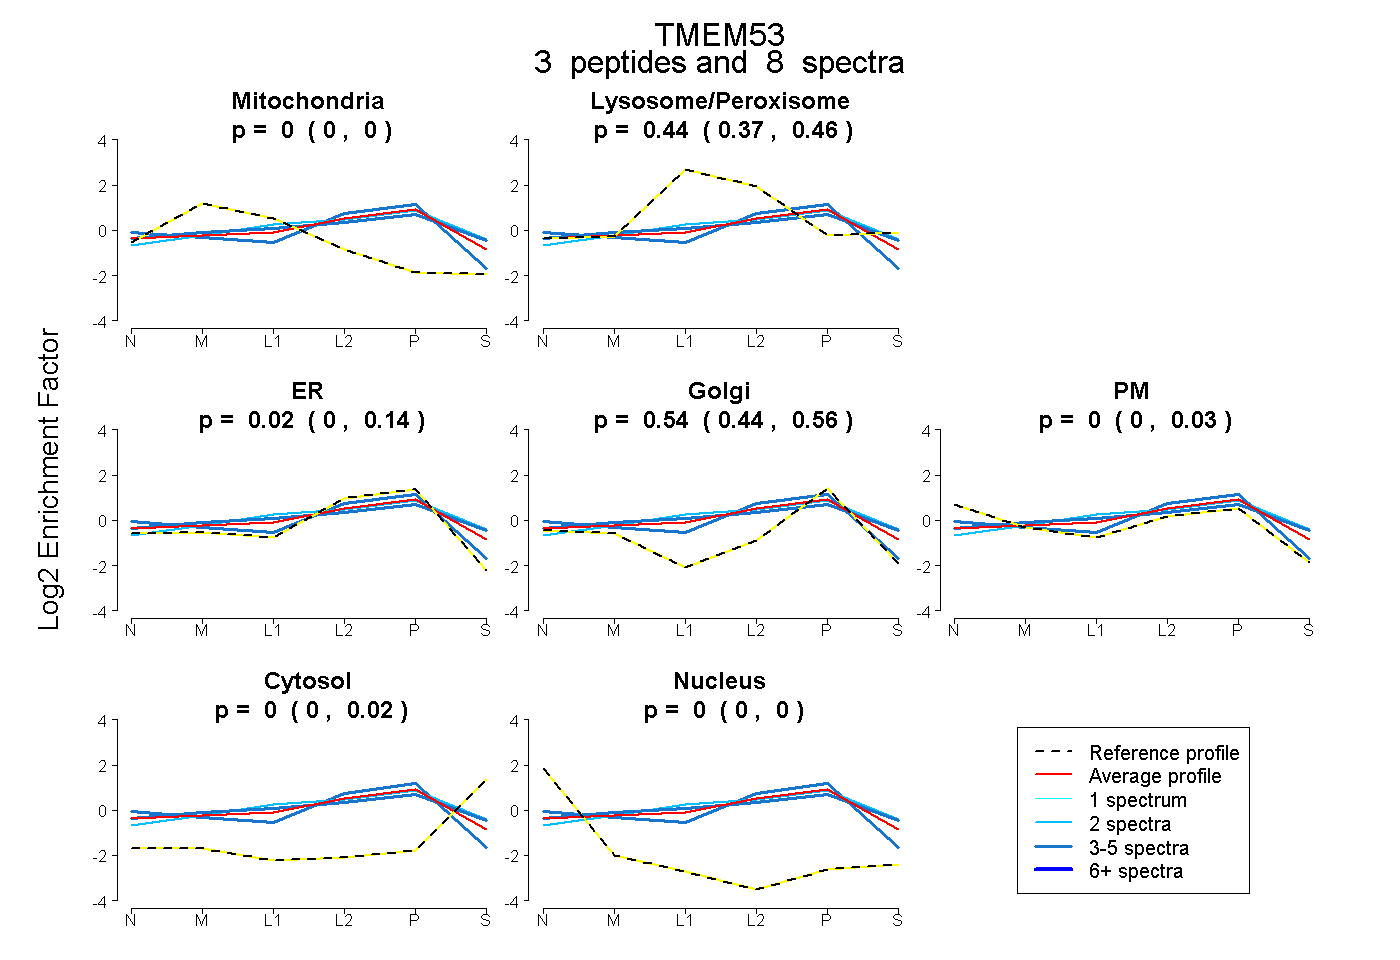 |
0.000 0.000 | 0.000 |
0.440 0.368 | 0.462 |
0.016 0.000 | 0.135 |
0.544 0.440 | 0.562 |
0.000 0.000 | 0.031 |
0.000 0.000 | 0.019 |
0.000 0.000 | 0.000 |
|||
| Plot | Lyso | Other | |||||||||||
| Expt C |
1 peptide |
4 spectra |
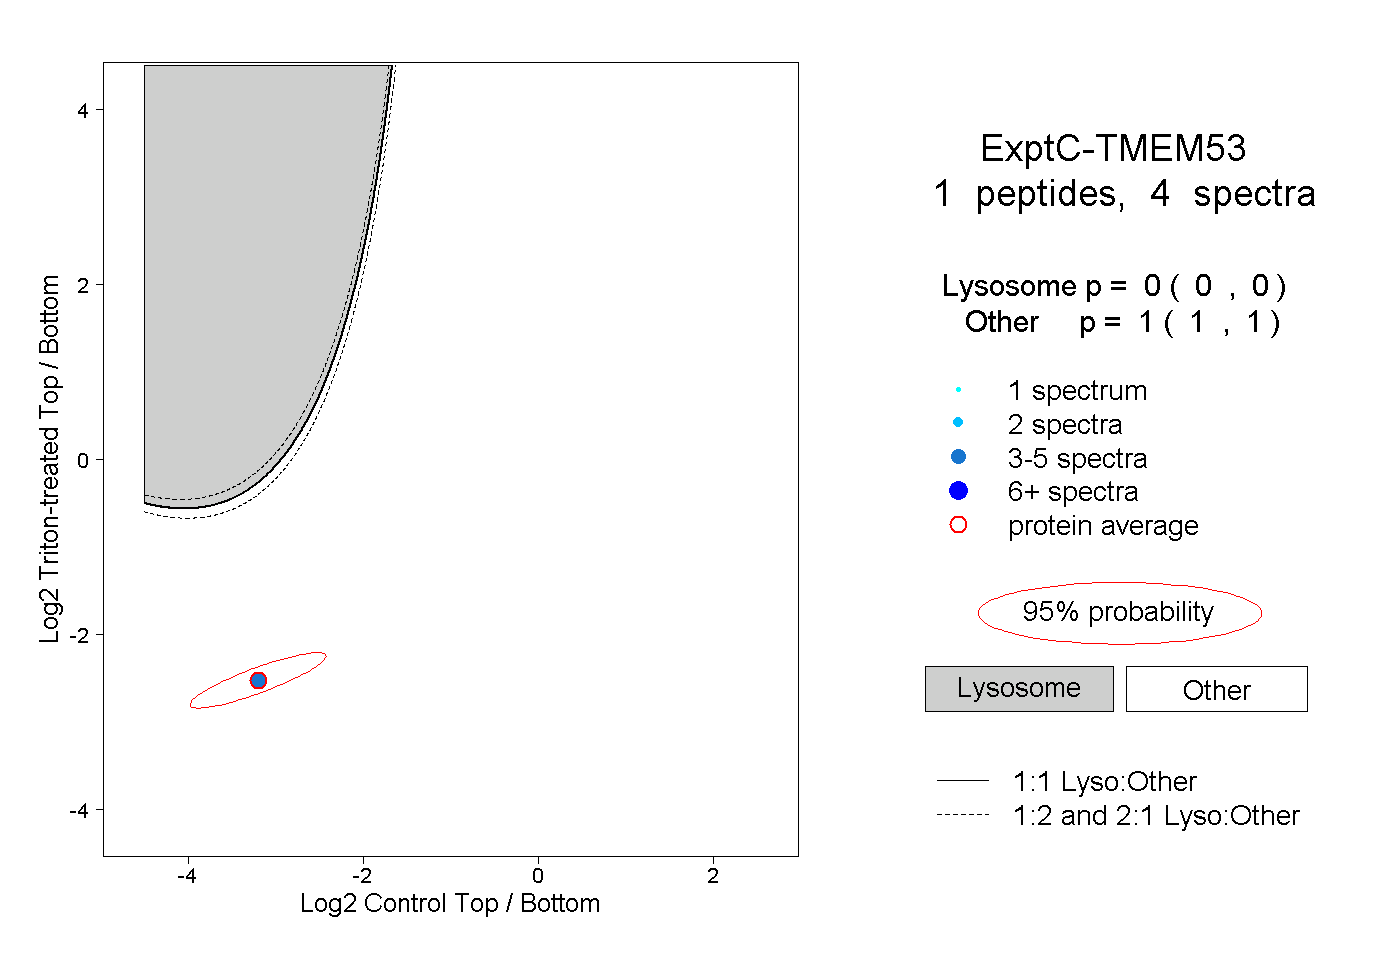 |
0.000 0.000 | 0.000 |
1.000 1.000 | 1.000 |
||||||||
| Plot | Lyso | Other | |||||||||||
| Expt D |
1 peptide |
2 spectra |
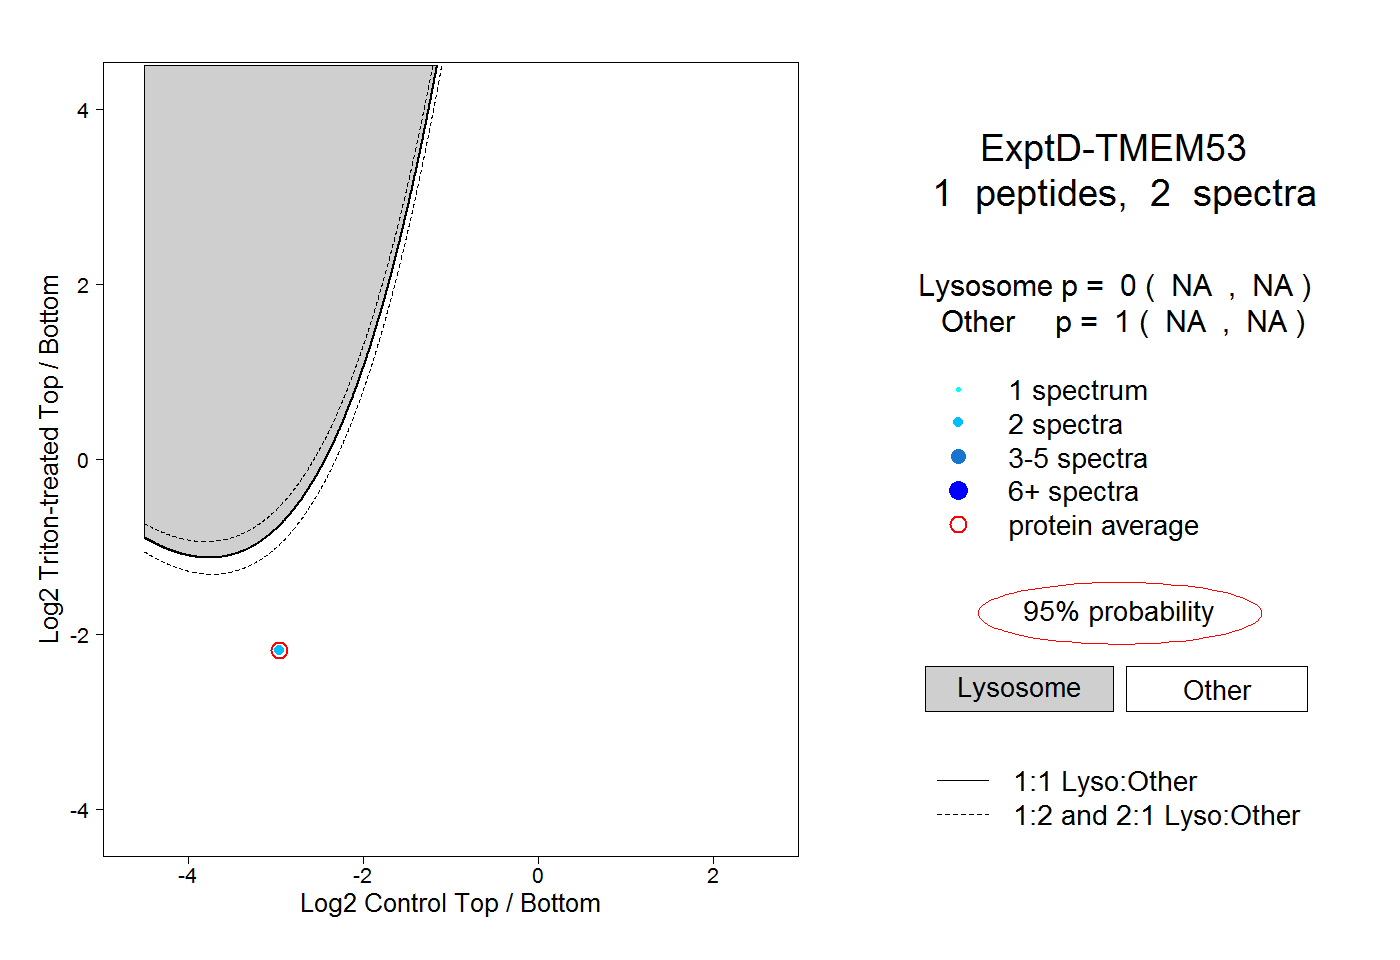 |
0.000 NA | NA |
1.000 NA | NA |