20
20peptides
spectra
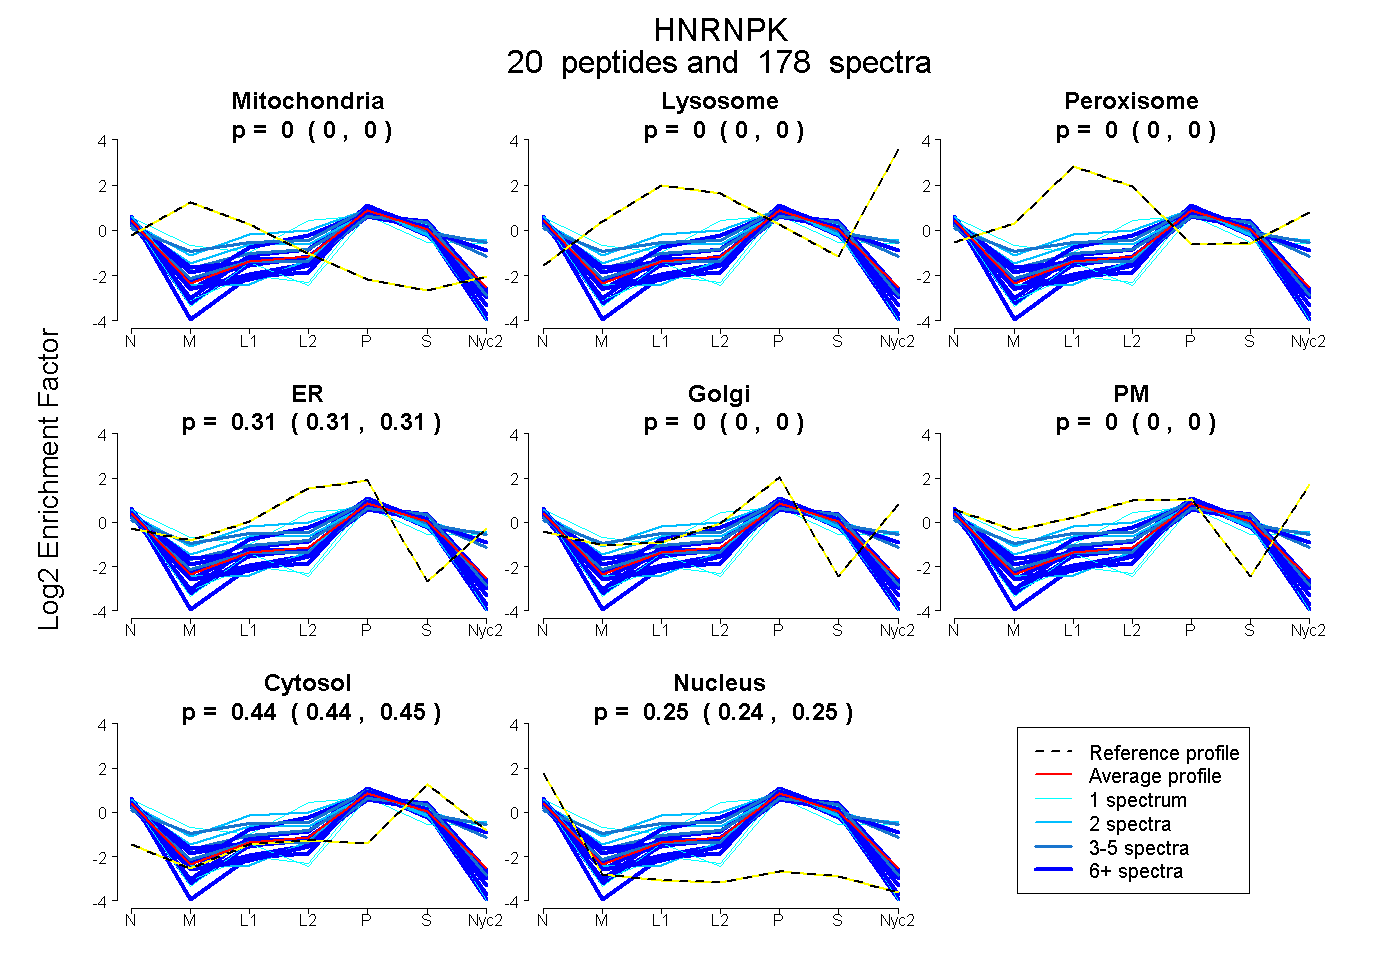
0.000 | 0.000
0.000 | 0.000
0.000 | 0.000
0.306 | 0.311
0.000 | 0.000
0.000 | 0.000
0.442 | 0.446
0.244 | 0.250
12peptides
spectra
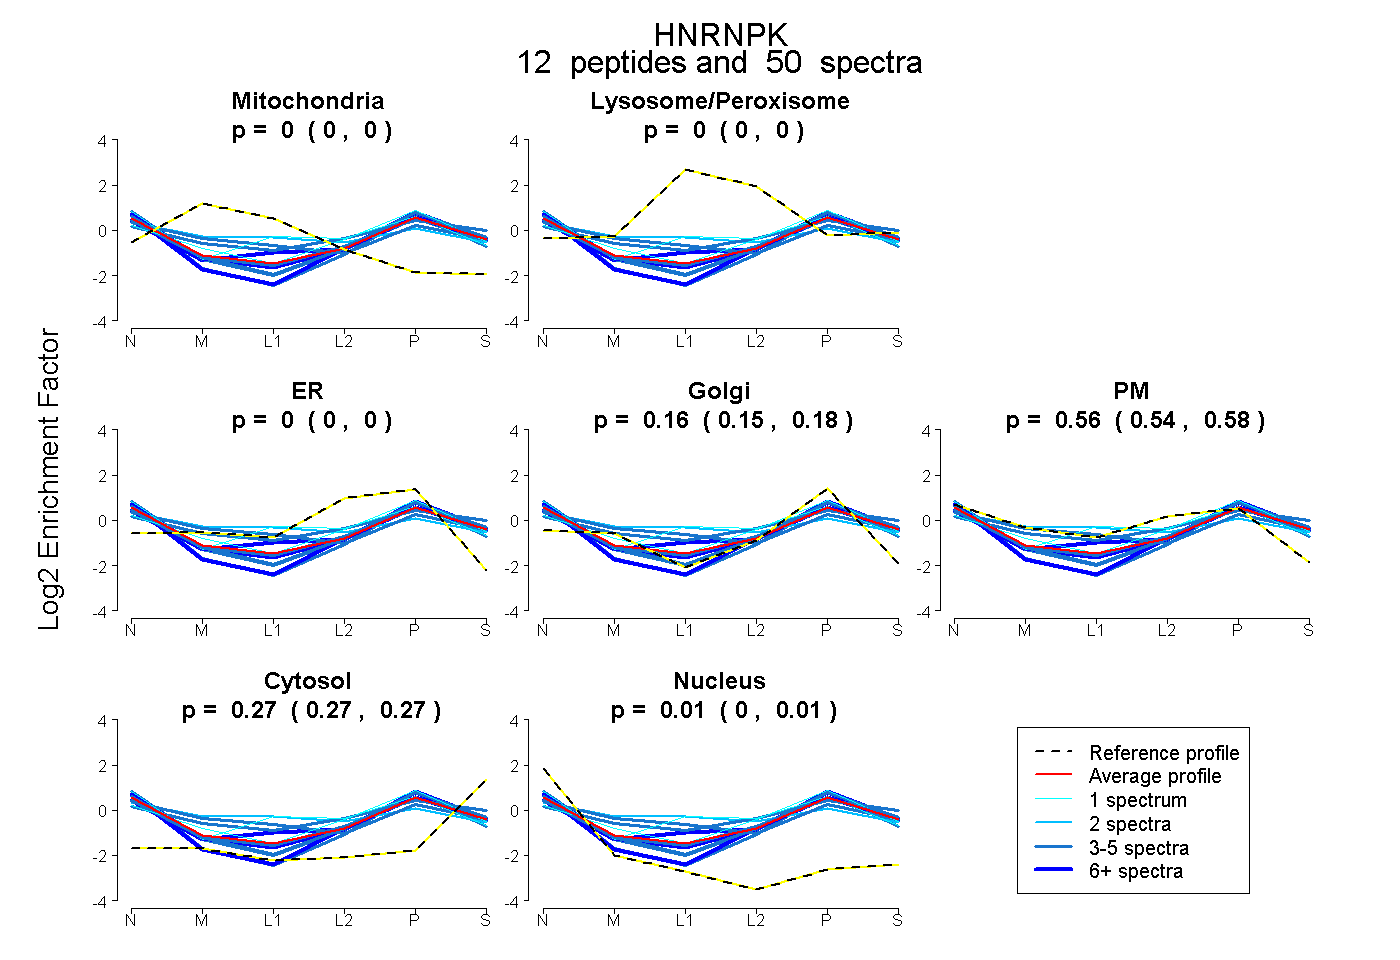
0.000 | 0.000
0.000 | 0.000
0.000 | 0.000
0.147 | 0.178
0.545 | 0.577
0.265 | 0.272
0.001 | 0.009
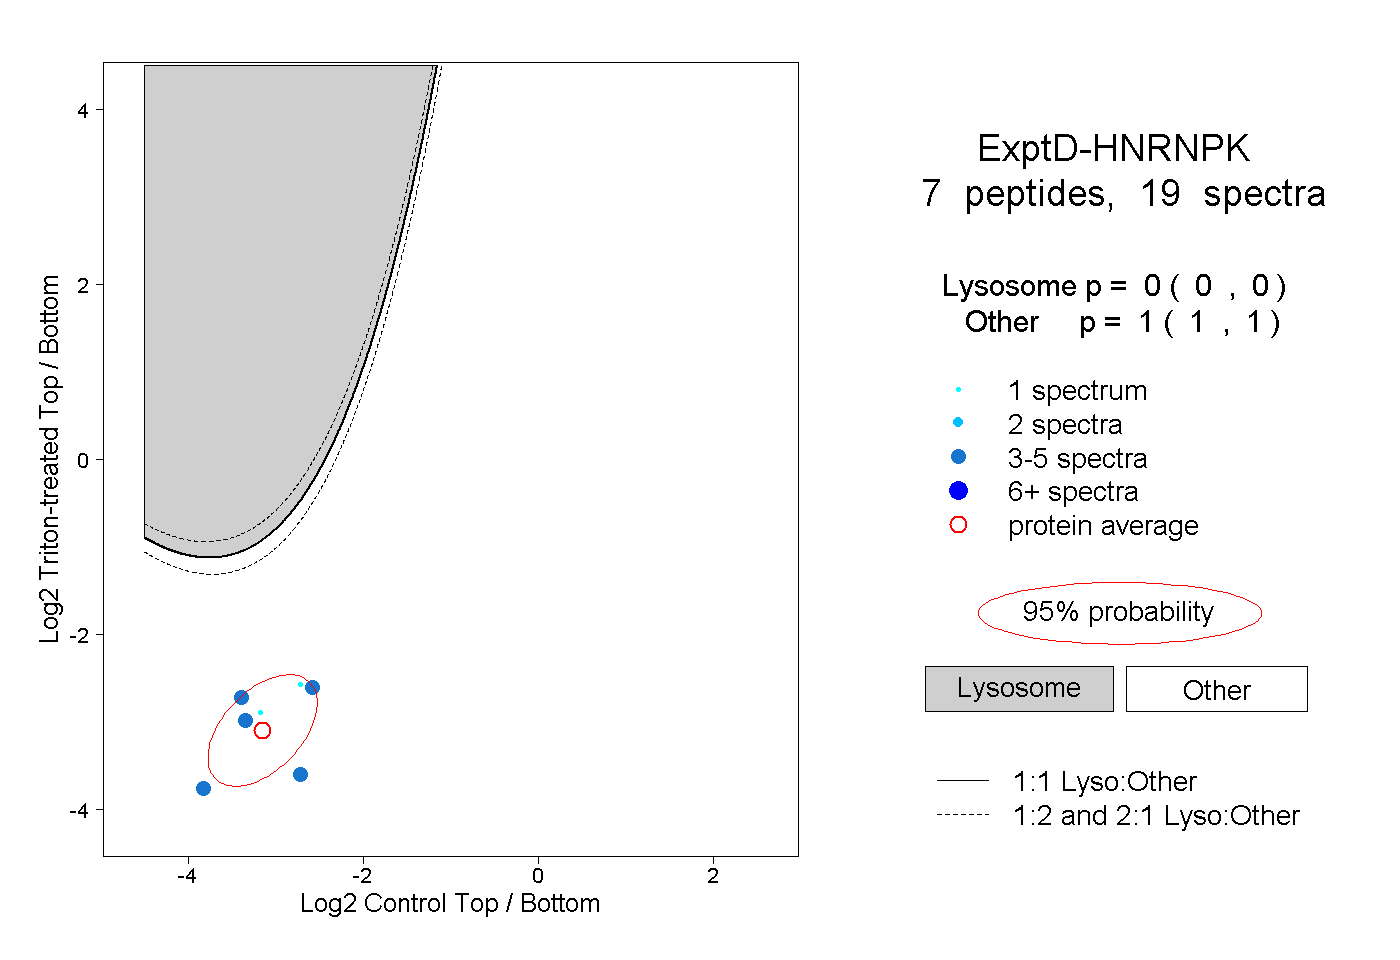
16peptides
spectra

0.000 | 0.000
1.000 | 1.000