21
21peptides
spectra
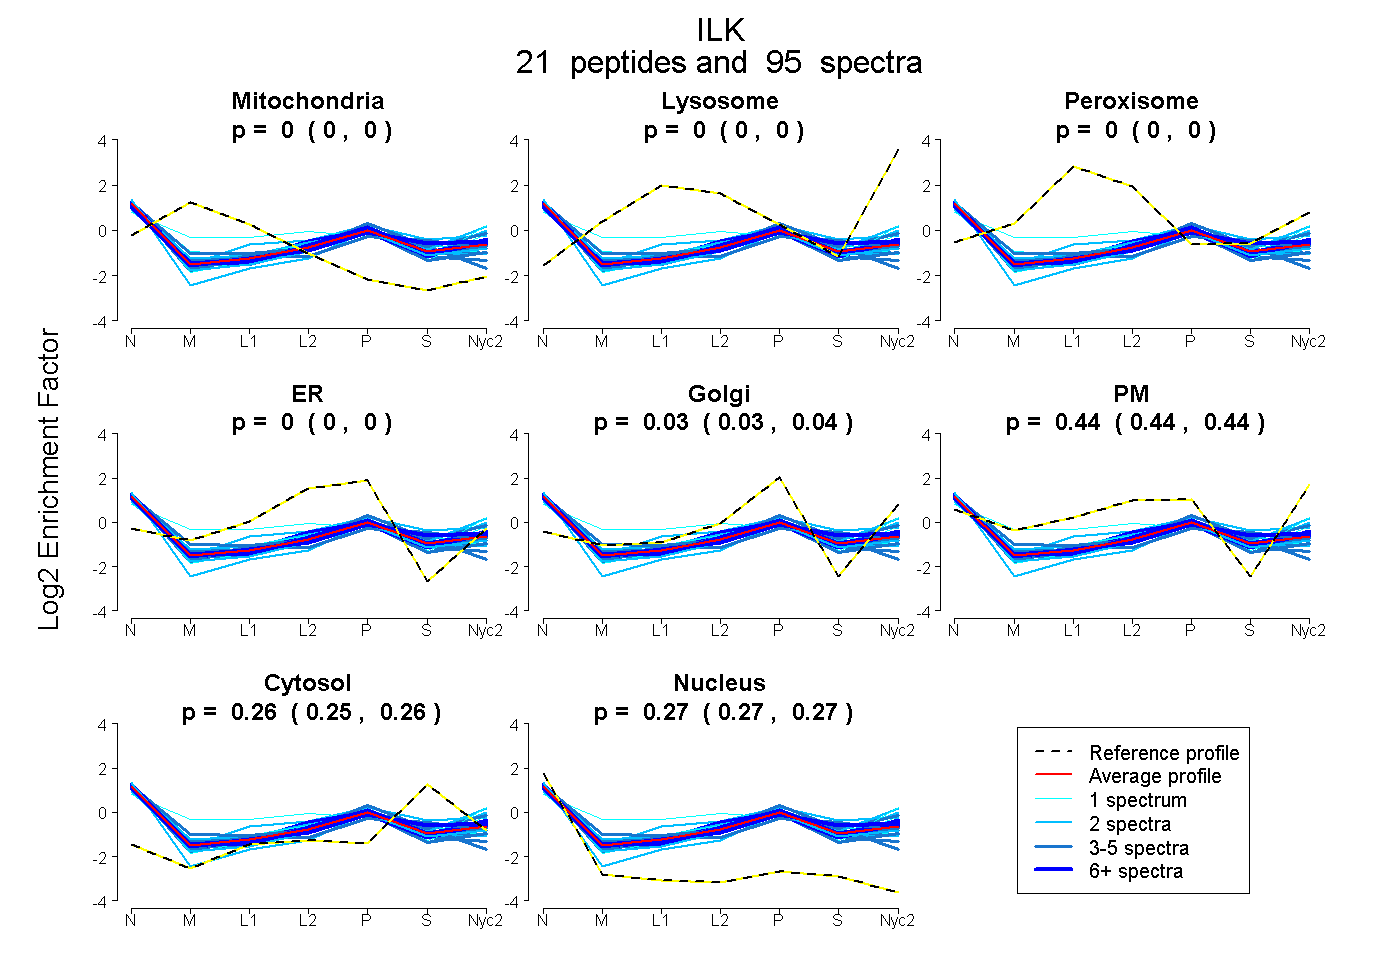
0.000 | 0.000
0.000 | 0.000
0.000 | 0.000
0.000 | 0.004
0.030 | 0.037
0.436 | 0.444
0.255 | 0.259
0.267 | 0.270
8peptides
spectra
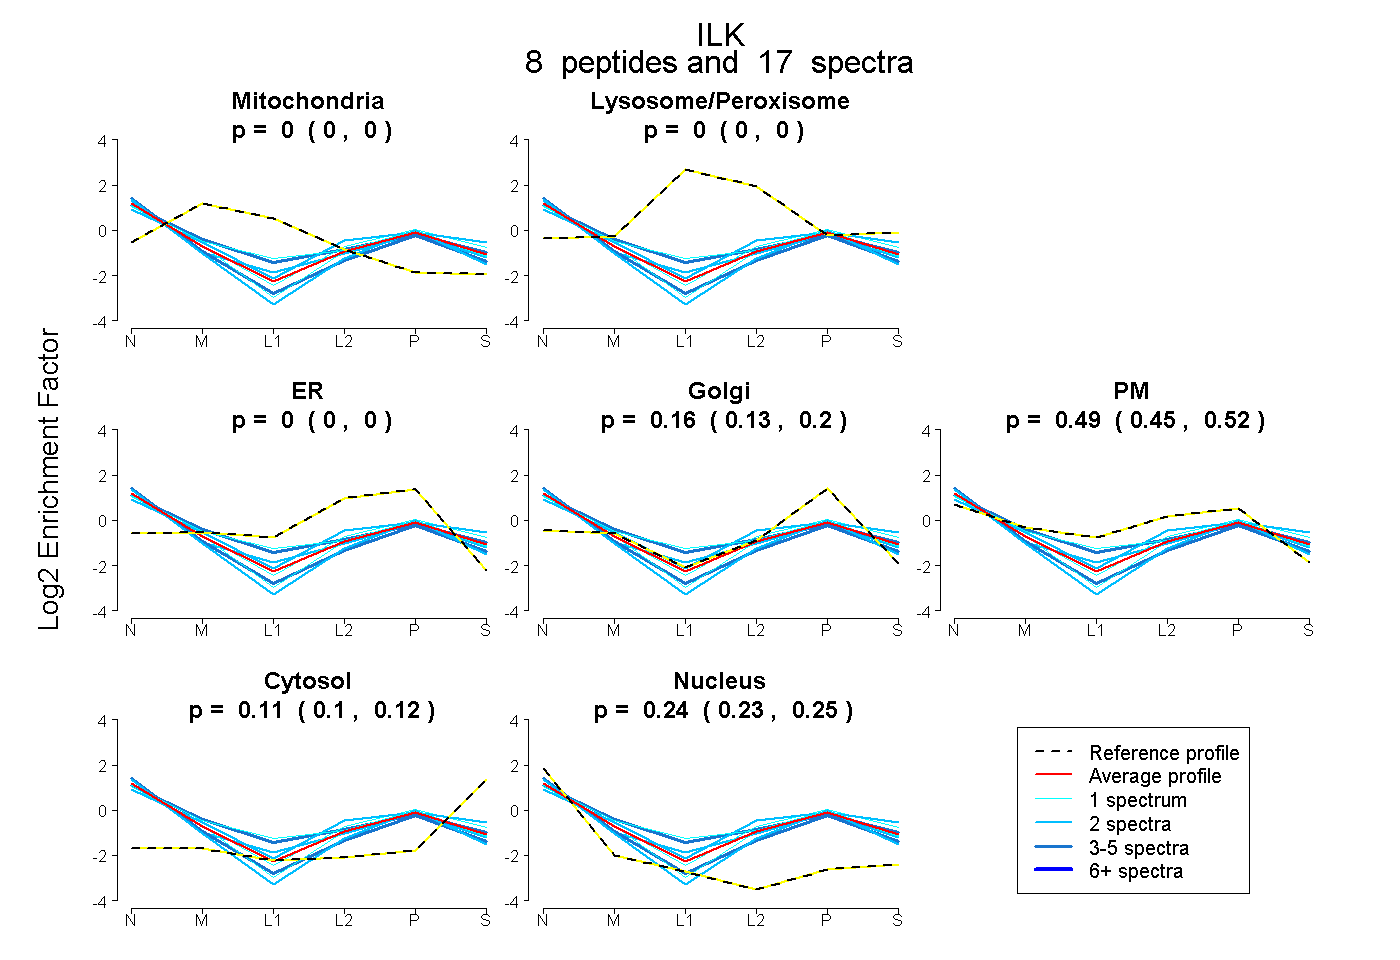
0.000 | 0.000
0.000 | 0.000
0.000 | 0.000
0.131 | 0.196
0.448 | 0.516
0.100 | 0.118
0.228 | 0.248