 21
21peptides
spectra
0.000 | 0.000
0.000 | 0.000
0.000 | 0.000
0.000 | 0.004
0.030 | 0.037
0.436 | 0.444
0.255 | 0.259
0.267 | 0.270
| Plot | Mito | Lyso | Perox | ER | Golgi | PM | Cytosol | Nucleus | |||||
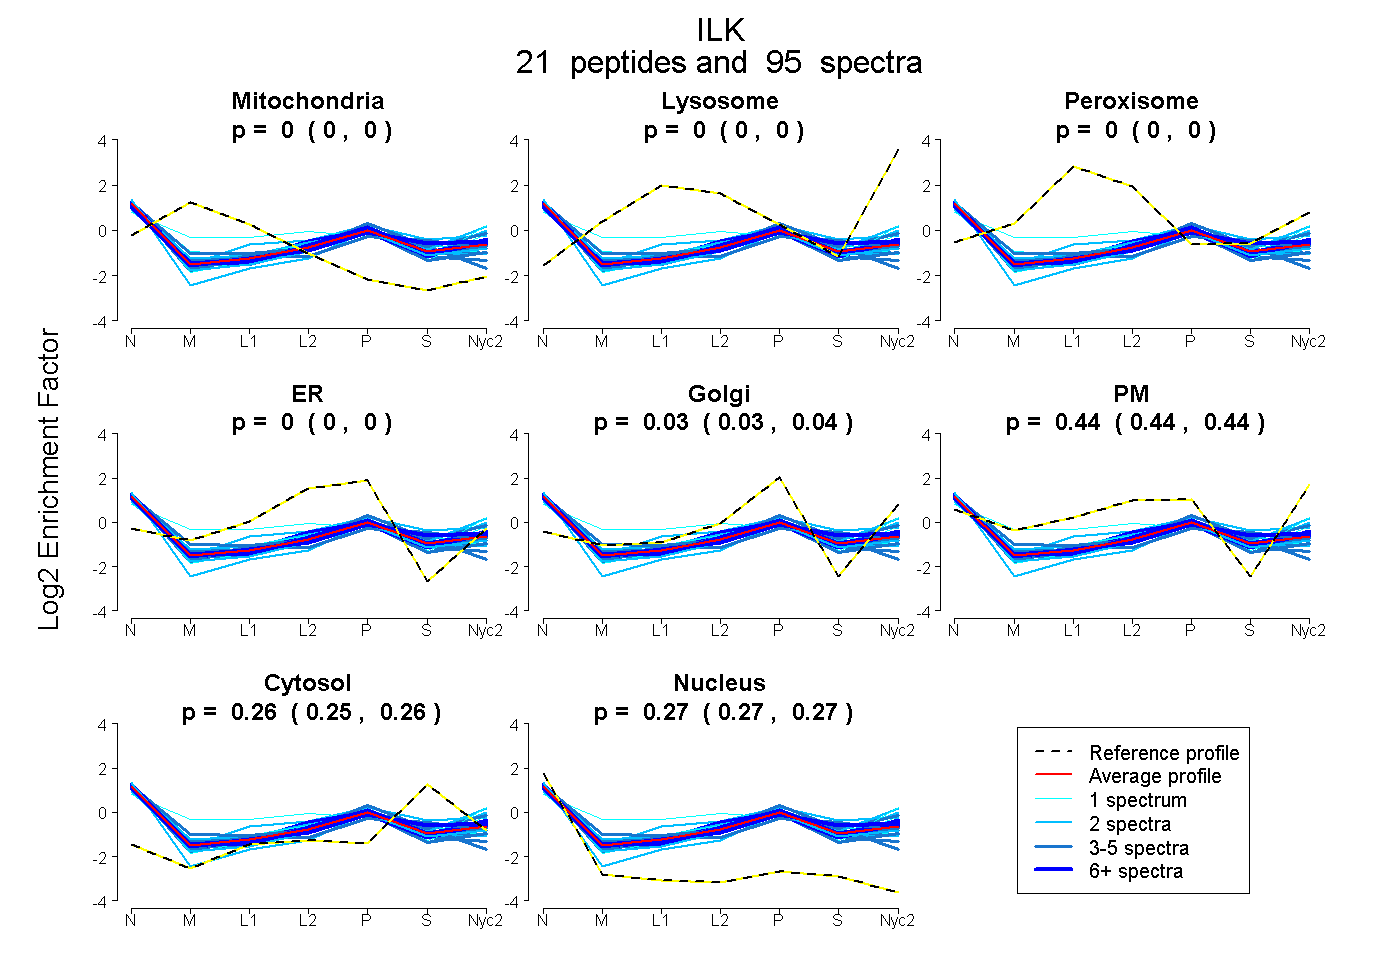
| Expt A |
21 peptides |
95 spectra |
|
0.000 0.000 | 0.000 |
0.000 0.000 | 0.000 |
0.000 0.000 | 0.000 |
0.000 0.000 | 0.004 |
0.034 0.030 | 0.037 |
0.440 0.436 | 0.444 |
0.257 0.255 | 0.259 |
0.269 0.267 | 0.270 |
| 2 spectra, FALDMAR | 0.000 | 0.000 | 0.000 | 0.000 | 0.052 | 0.476 | 0.236 | 0.236 | ||
| 5 spectra, ICMNEDPAK | 0.000 | 0.000 | 0.000 | 0.380 | 0.000 | 0.043 | 0.288 | 0.289 | ||
| 4 spectra, FSFQCPGR | 0.000 | 0.000 | 0.000 | 0.168 | 0.000 | 0.276 | 0.205 | 0.351 | ||
| 1 spectrum, GDDTPLHLAASHGHR | 0.101 | 0.000 | 0.251 | 0.144 | 0.000 | 0.133 | 0.182 | 0.189 | ||
| 3 spectra, LNENHSGELWK | 0.000 | 0.000 | 0.000 | 0.000 | 0.000 | 0.492 | 0.298 | 0.210 | ||
| 5 spectra, EGNAVAVR | 0.000 | 0.000 | 0.000 | 0.019 | 0.124 | 0.346 | 0.225 | 0.285 | ||
| 2 spectra, EVPFADLSNMEIGMK | 0.000 | 0.000 | 0.014 | 0.005 | 0.000 | 0.481 | 0.371 | 0.129 | ||
| 13 spectra, SVMIDEDMTAR | 0.000 | 0.000 | 0.000 | 0.000 | 0.012 | 0.466 | 0.230 | 0.292 | ||
| 13 spectra, YGEMPVDK | 0.000 | 0.000 | 0.000 | 0.000 | 0.000 | 0.428 | 0.339 | 0.233 | ||
| 7 spectra, FDMIVPILEK | 0.000 | 0.000 | 0.000 | 0.000 | 0.081 | 0.424 | 0.221 | 0.273 | ||
| 8 spectra, SAVVEMLIMR | 0.000 | 0.000 | 0.000 | 0.000 | 0.086 | 0.412 | 0.246 | 0.256 | ||
| 3 spectra, VALEGLRPTIPPGISPHVCK | 0.000 | 0.000 | 0.000 | 0.000 | 0.000 | 0.372 | 0.371 | 0.258 | ||
| 1 spectrum, KPEDTNR | 0.000 | 0.000 | 0.000 | 0.000 | 0.127 | 0.405 | 0.194 | 0.275 | ||
| 2 spectra, WQGNDIVVK | 0.000 | 0.000 | 0.000 | 0.000 | 0.096 | 0.357 | 0.222 | 0.325 | ||
| 4 spectra, GMAFLHTLEPLIPR | 0.000 | 0.000 | 0.000 | 0.000 | 0.056 | 0.438 | 0.224 | 0.282 | ||
| 4 spectra, DFNEECPR | 0.000 | 0.000 | 0.000 | 0.124 | 0.000 | 0.314 | 0.277 | 0.284 | ||
| 2 spectra, MYAPAWVAPEALQK | 0.000 | 0.000 | 0.000 | 0.000 | 0.000 | 0.537 | 0.276 | 0.187 | ||
| 1 spectrum, NGTLNK | 0.000 | 0.000 | 0.000 | 0.000 | 0.000 | 0.608 | 0.167 | 0.224 | ||
| 9 spectra, MGQNLNR | 0.000 | 0.000 | 0.000 | 0.000 | 0.000 | 0.517 | 0.223 | 0.261 | ||
| 4 spectra, QLNFLAK | 0.011 | 0.000 | 0.038 | 0.085 | 0.000 | 0.392 | 0.149 | 0.325 | ||
| 2 spectra, HSGIDFK | 0.000 | 0.000 | 0.000 | 0.000 | 0.225 | 0.179 | 0.233 | 0.362 |
| Plot | Mito | Lyso or Perox | ER | Golgi | PM | Cytosol | Nucleus | ||||||
| Expt B |
8 peptides |
17 spectra |
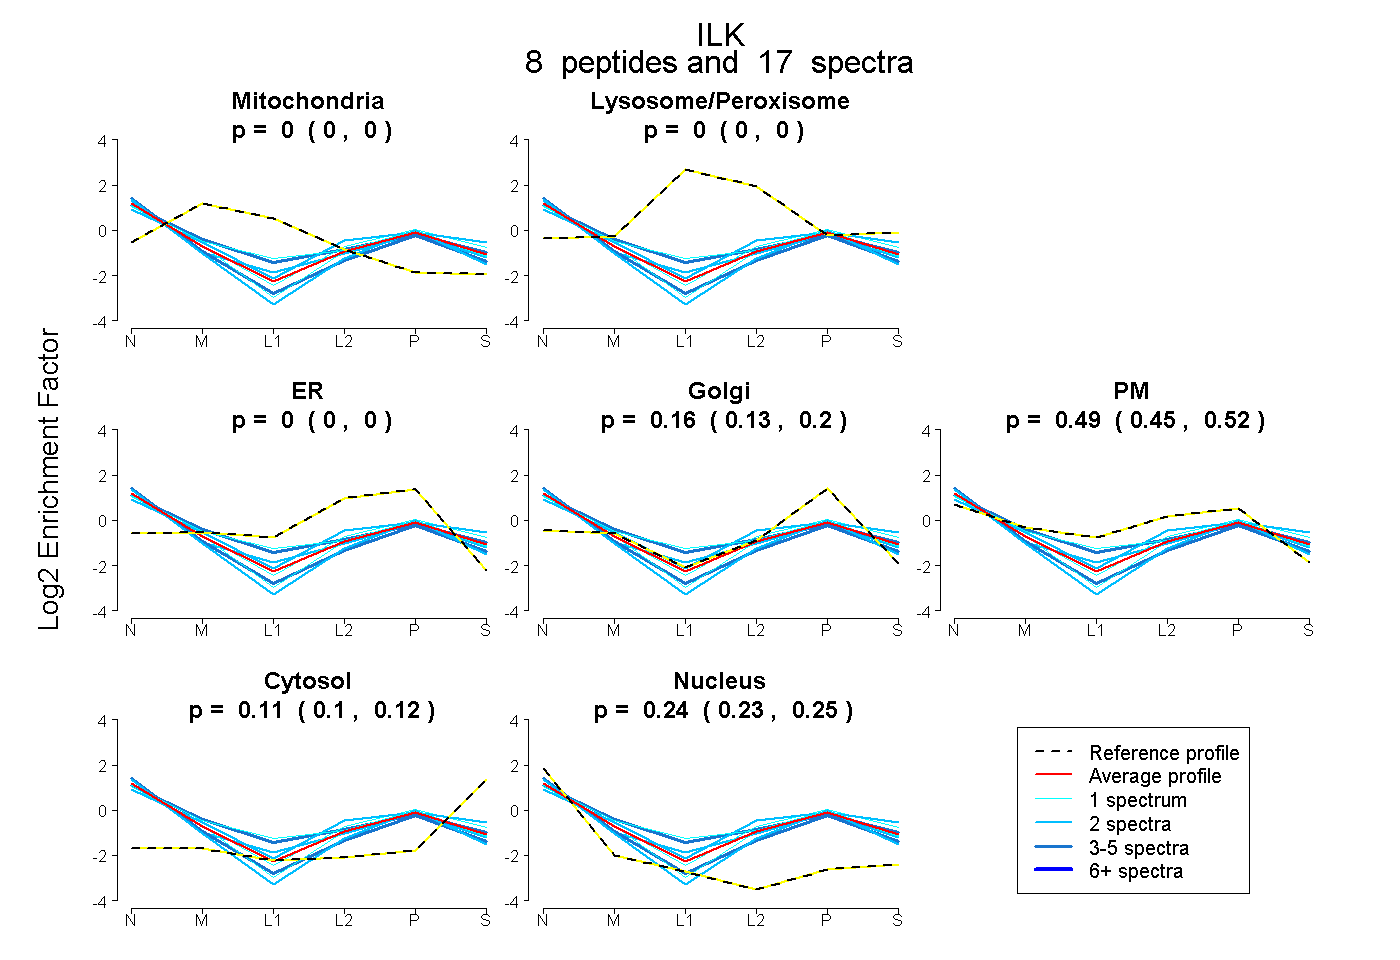 |
0.000 0.000 | 0.000 |
0.000 0.000 | 0.000 |
0.000 0.000 | 0.000 |
0.164 0.131 | 0.196 |
0.487 0.448 | 0.516 |
0.110 0.100 | 0.118 |
0.239 0.228 | 0.248 |
|||
| Plot | Lyso | Other | |||||||||||
| Expt C |
18 peptides |
71 spectra |
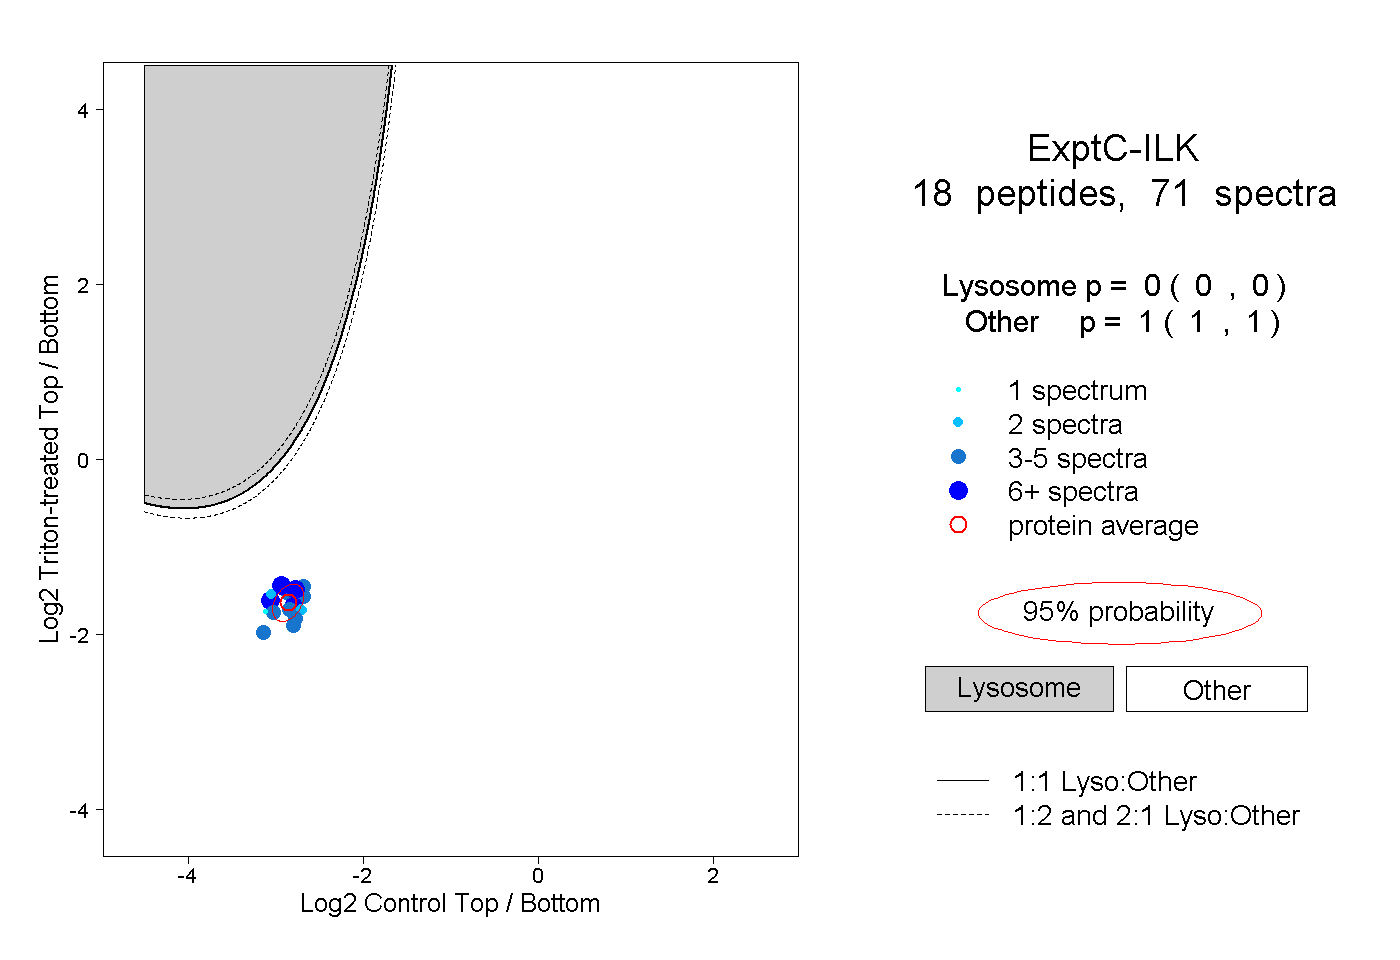 |
0.000 0.000 | 0.000 |
1.000 1.000 | 1.000 |
||||||||
| Plot | Lyso | Other | |||||||||||
| Expt D |
3 peptides |
4 spectra |
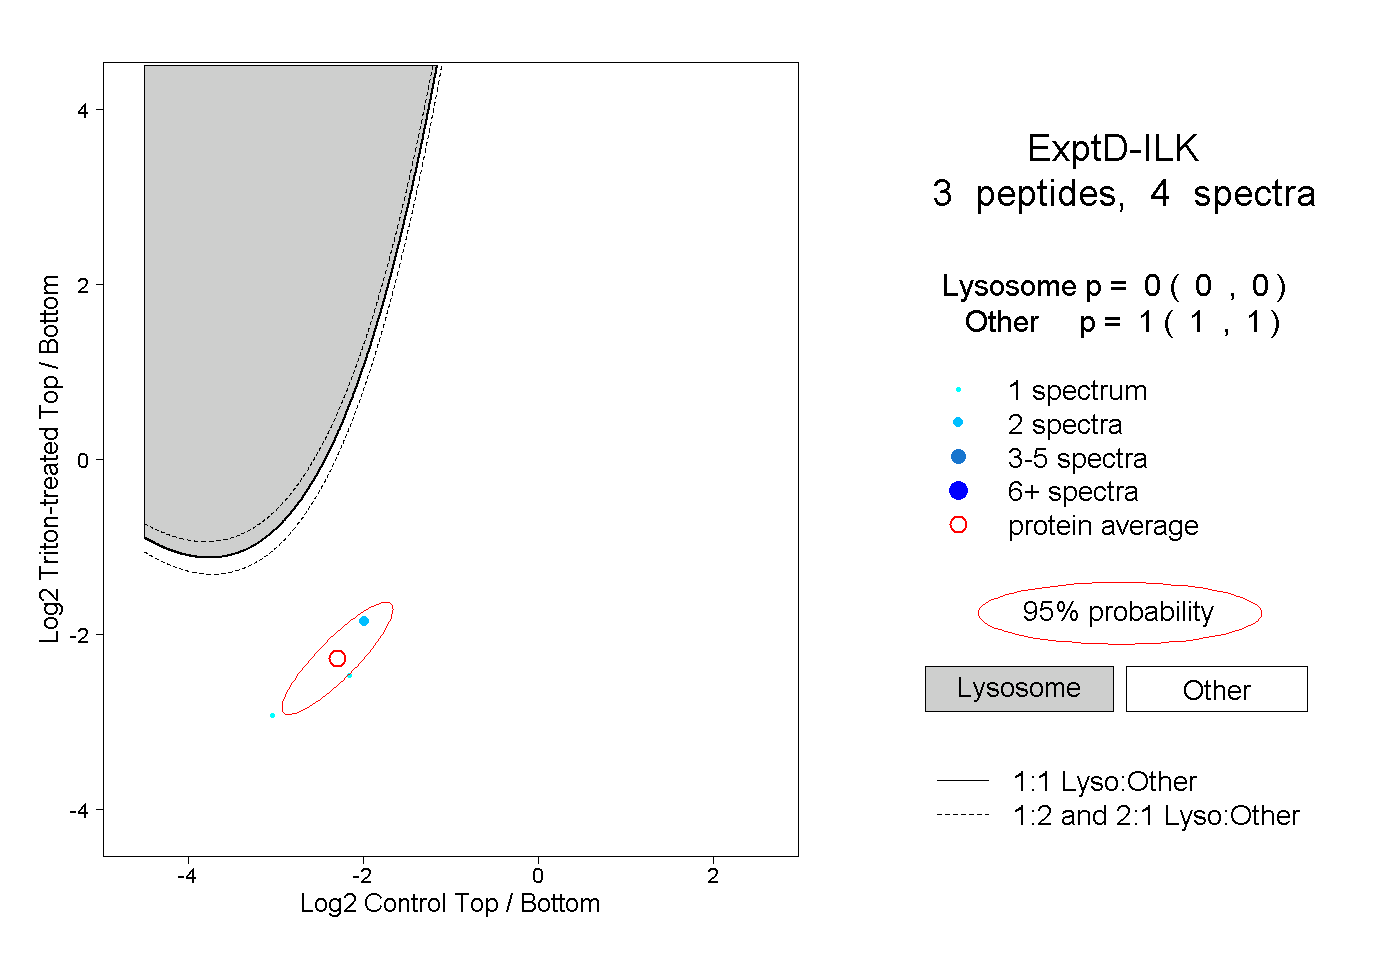 |
0.000 0.000 | 0.000 |
1.000 1.000 | 1.000 |