 2
2peptides
spectra
0.000 | 0.000
0.775 | 0.997
0.000 | 0.000
0.000 | 0.076
0.000 | 0.099
0.000 | 0.184
0.000 | 0.000
0.000 | 0.000
3peptides
spectra
0.000 | 1.000
0.000 | 1.000
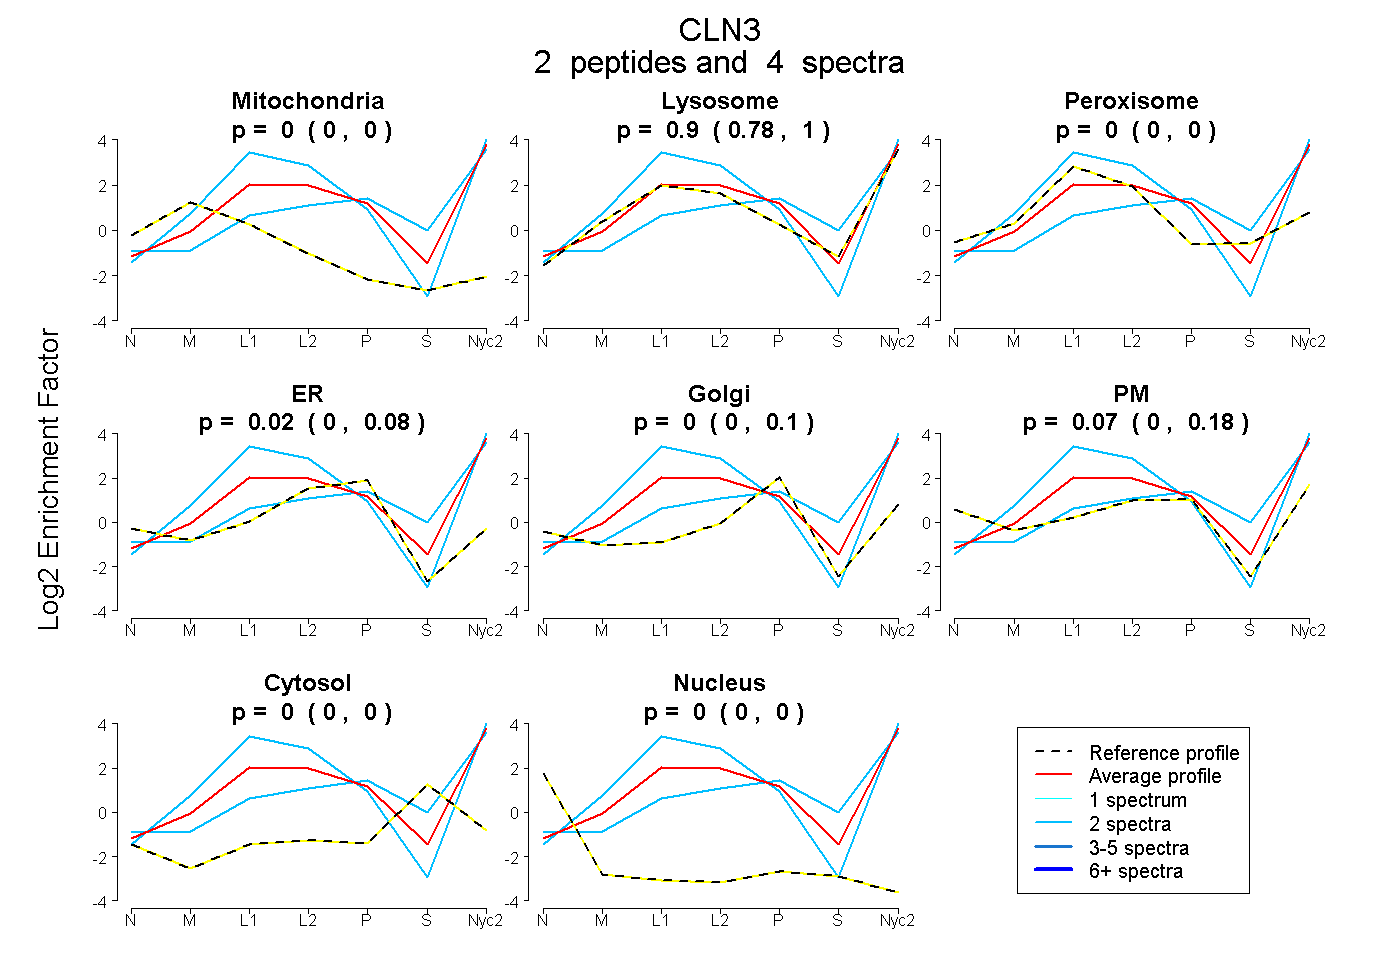
| Plot | Mito | Lyso | Perox | ER | Golgi | PM | Cytosol | Nucleus | |||||
| Expt A |
2 peptides |
4 spectra |
|
0.000 0.000 | 0.000 |
0.903 0.775 | 0.997 |
0.000 0.000 | 0.000 |
0.024 0.000 | 0.076 |
0.000 0.000 | 0.099 |
0.073 0.000 | 0.184 |
0.000 0.000 | 0.000 |
0.000 0.000 | 0.000 |
||
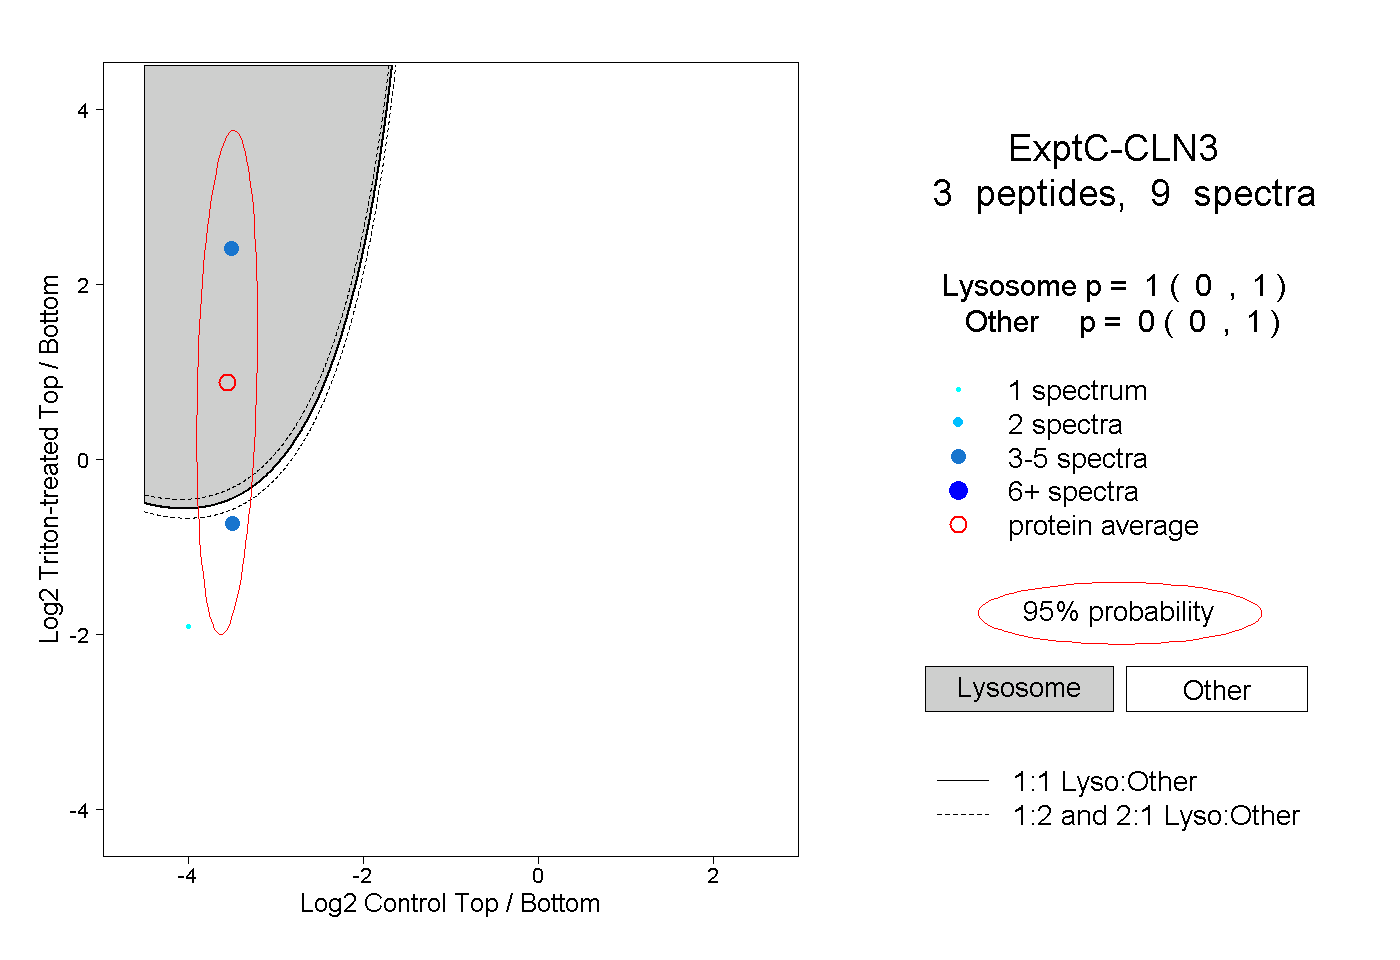
| Plot | Lyso | Other | |||||||||||
| Expt C |
3 peptides |
9 spectra |
|
1.000 0.000 | 1.000 |
0.000 0.000 | 1.000 |