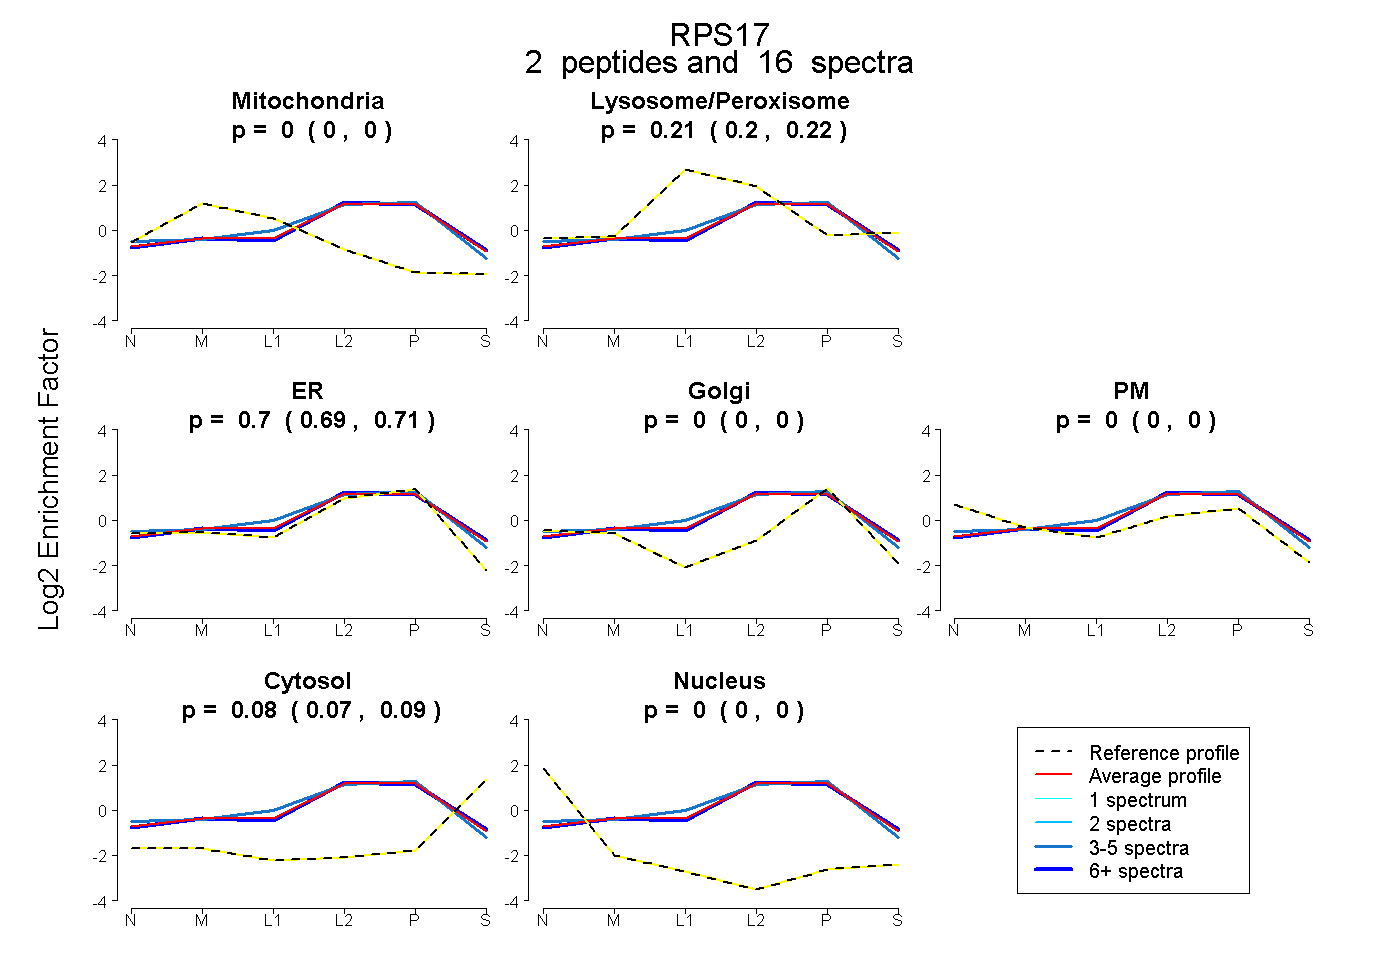
 2
2peptides
spectra

0.000 | 0.000
0.000 | 0.000
0.000 | 0.000
0.868 | 0.873
0.000 | 0.000
0.000 | 0.000
0.126 | 0.132
0.000 | 0.000
2peptides
spectra
0.000 | 0.000
0.200 | 0.224
0.689 | 0.715
0.000 | 0.000
0.000 | 0.000
0.075 | 0.092
0.000 | 0.000
3peptides
spectra
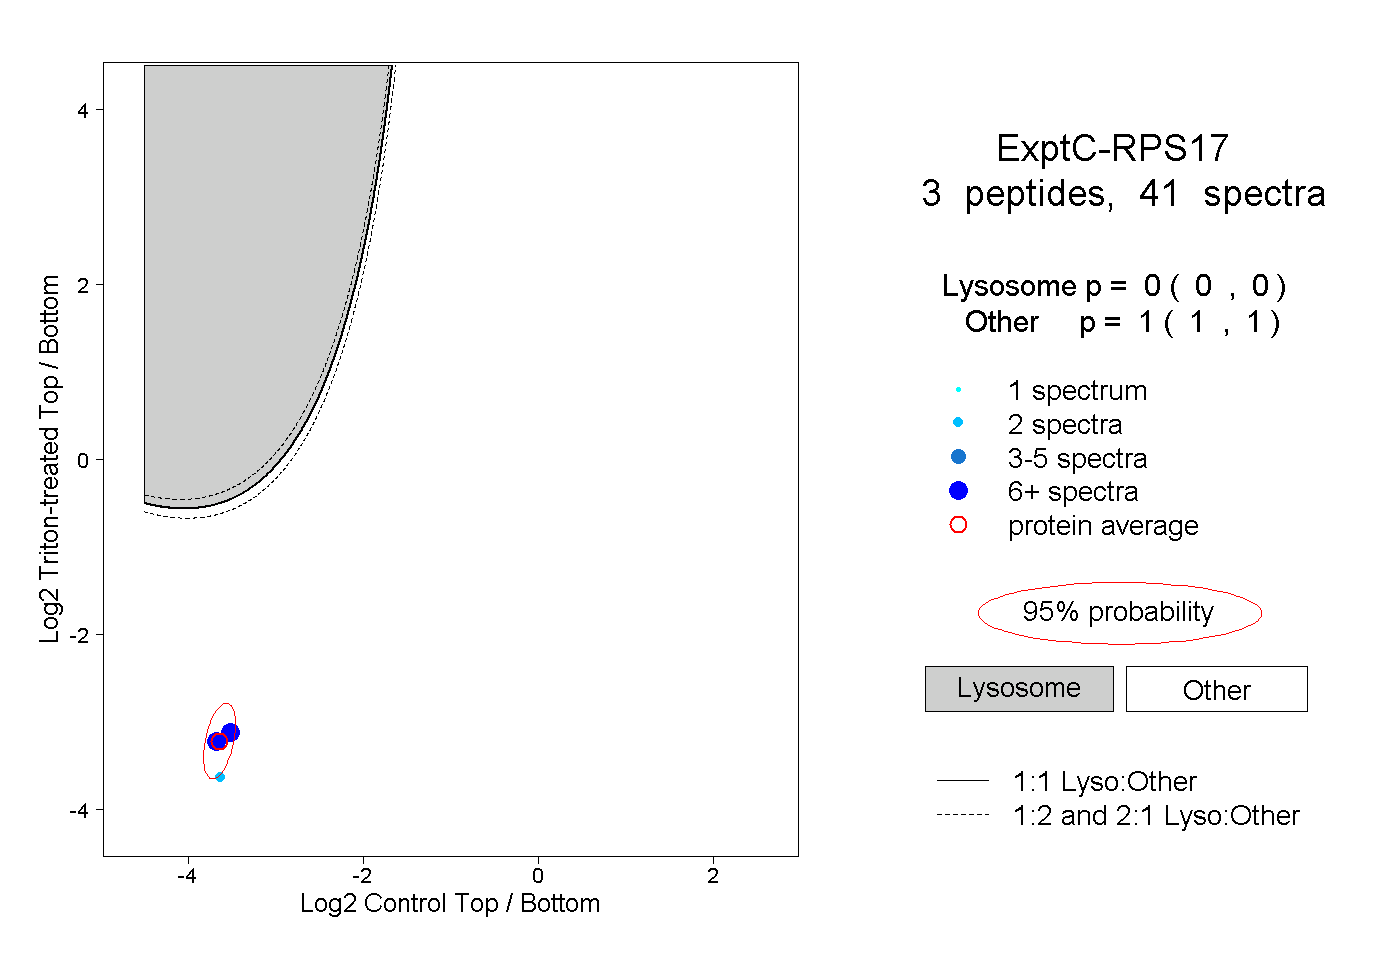
0.000 | 0.000
1.000 | 1.000
3peptides
spectra
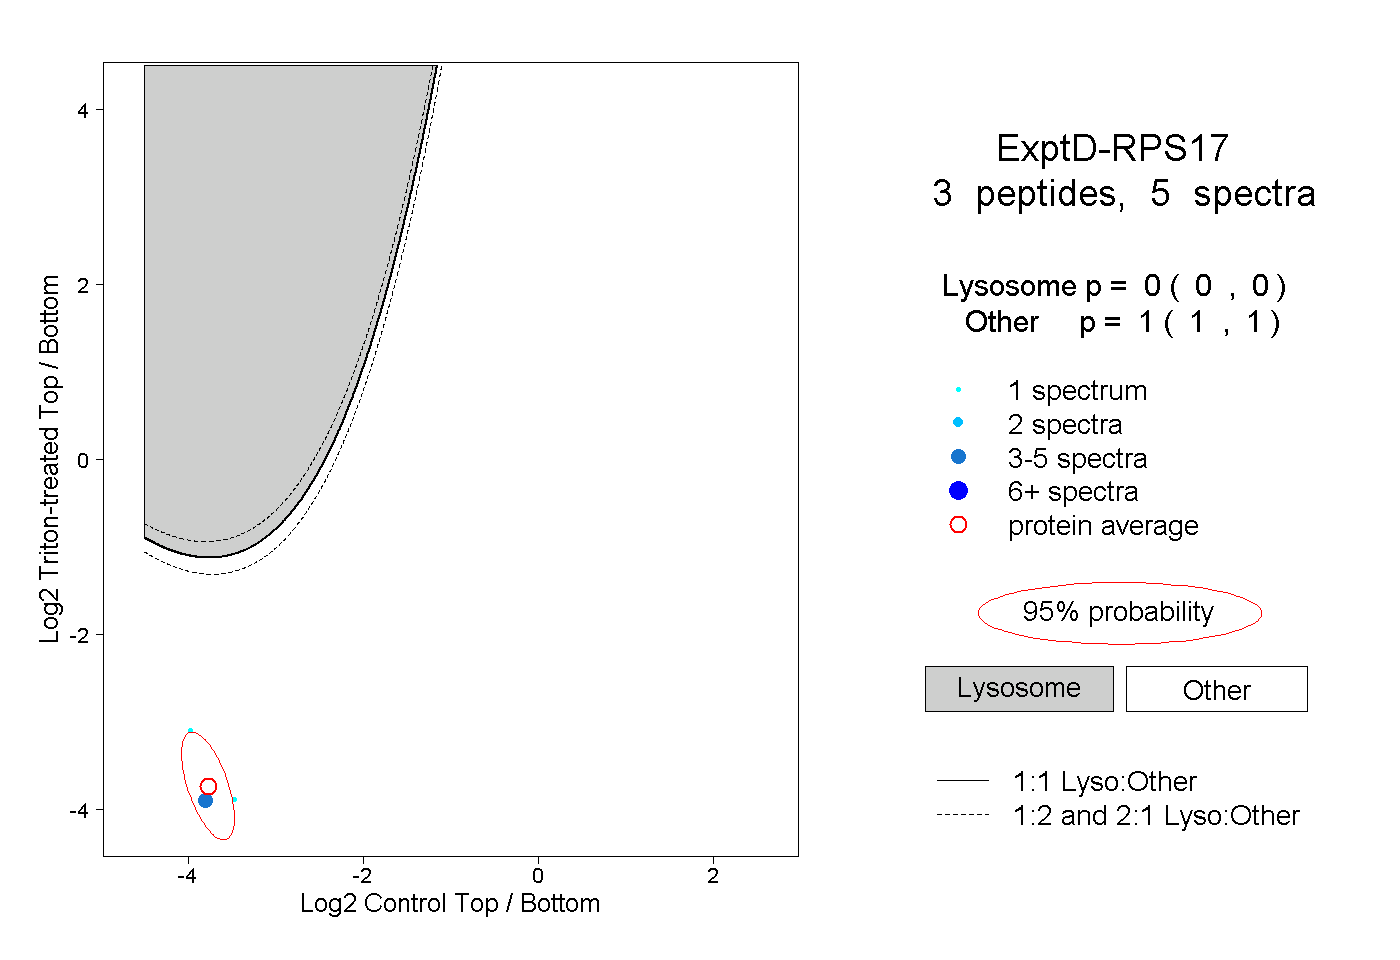
0.000 | 0.000
1.000 | 1.000