 21
21peptides
spectra
0.000 | 0.000
0.164 | 0.180
0.644 | 0.666
0.163 | 0.178
0.000 | 0.000
0.000 | 0.000
0.000 | 0.000
0.000 | 0.000
| Plot | Mito | Lyso | Perox | ER | Golgi | PM | Cytosol | Nucleus | |||||
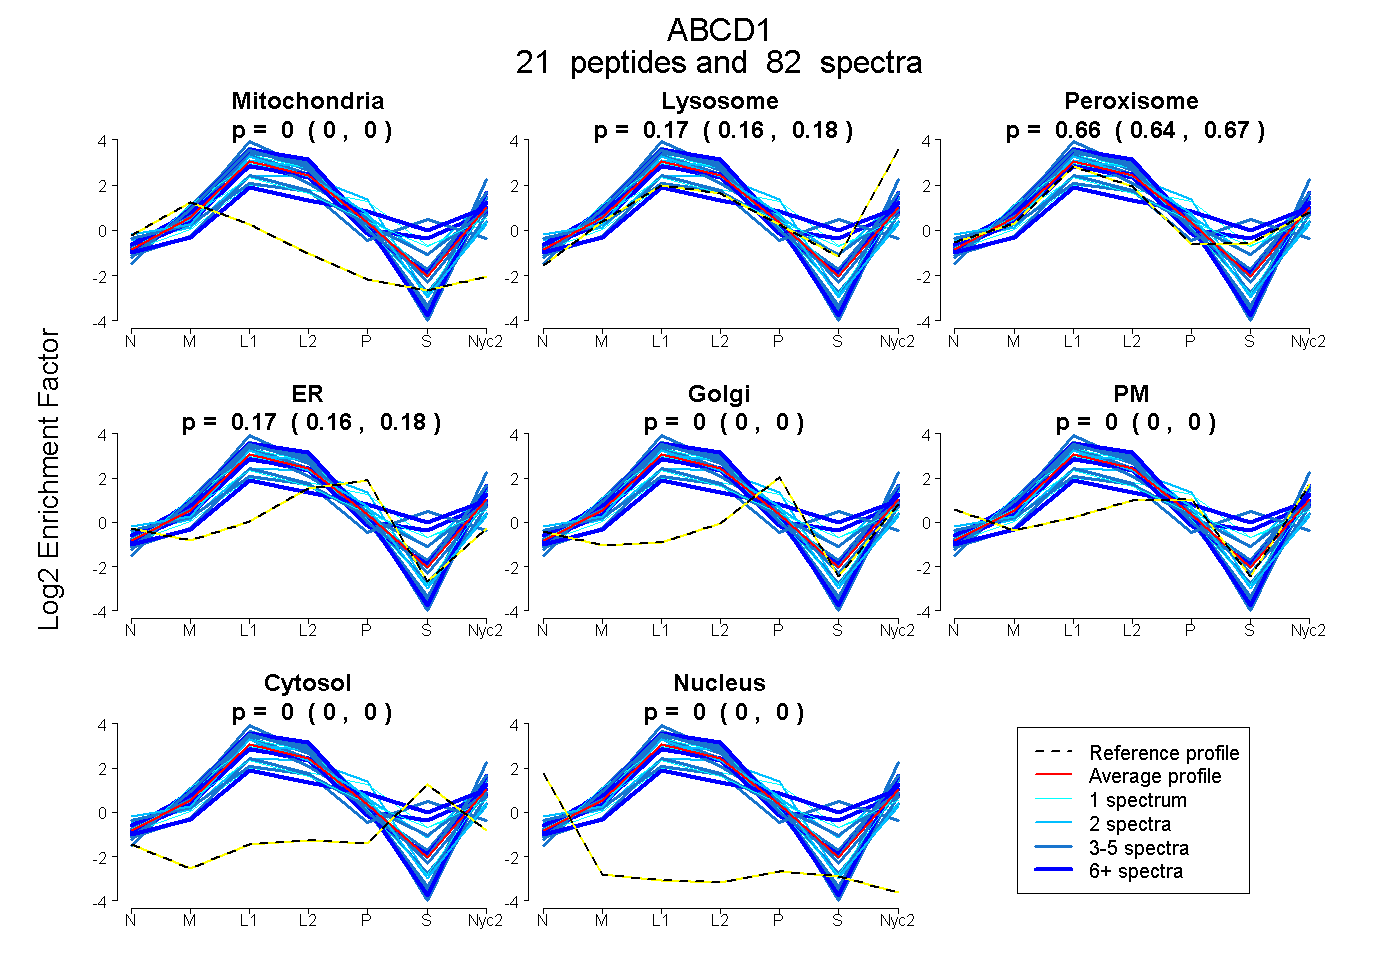
| Expt A |
21 peptides |
82 spectra |
|
0.000 0.000 | 0.000 |
0.173 0.164 | 0.180 |
0.656 0.644 | 0.666 |
0.171 0.163 | 0.178 |
0.000 0.000 | 0.000 |
0.000 0.000 | 0.000 |
0.000 0.000 | 0.000 |
0.000 0.000 | 0.000 |
| 5 spectra, MFYIPQRPYMSVGSLR | 0.000 | 0.506 | 0.428 | 0.065 | 0.000 | 0.000 | 0.000 | 0.000 | ||
| 1 spectrum, GCSEQQLEAILGIVHLR | 0.000 | 0.042 | 0.578 | 0.380 | 0.000 | 0.000 | 0.000 | 0.000 | ||
| 2 spectra, FGELVAEEAR | 0.000 | 0.272 | 0.655 | 0.073 | 0.000 | 0.000 | 0.000 | 0.000 | ||
| 8 spectra, LDSAAR | 0.000 | 0.047 | 0.921 | 0.032 | 0.000 | 0.000 | 0.000 | 0.000 | ||
| 3 spectra, ETGLLALHSAALVSR | 0.000 | 0.334 | 0.408 | 0.258 | 0.000 | 0.000 | 0.000 | 0.000 | ||
| 1 spectrum, TEAFTIAR | 0.034 | 0.262 | 0.537 | 0.168 | 0.000 | 0.000 | 0.000 | 0.000 | ||
| 2 spectra, DVLSGGEK | 0.000 | 0.027 | 0.431 | 0.542 | 0.000 | 0.000 | 0.000 | 0.000 | ||
| 4 spectra, TFLSVYVAR | 0.000 | 0.350 | 0.650 | 0.000 | 0.000 | 0.000 | 0.000 | 0.000 | ||
| 1 spectrum, YHTHLLQFDGEGGWK | 0.000 | 0.035 | 0.779 | 0.158 | 0.028 | 0.000 | 0.000 | 0.000 | ||
| 5 spectra, LLFPGVLCR | 0.000 | 0.112 | 0.690 | 0.198 | 0.000 | 0.000 | 0.000 | 0.000 | ||
| 4 spectra, EVTELAGYTAR | 0.000 | 0.212 | 0.781 | 0.007 | 0.000 | 0.000 | 0.000 | 0.000 | ||
| 1 spectrum, LLVLLR | 0.000 | 0.279 | 0.613 | 0.108 | 0.000 | 0.000 | 0.000 | 0.000 | ||
| 3 spectra, EGGWEAVCDWK | 0.000 | 0.000 | 0.757 | 0.243 | 0.000 | 0.000 | 0.000 | 0.000 | ||
| 4 spectra, VYEMFQVFEDVQHCR | 0.000 | 0.073 | 0.654 | 0.178 | 0.000 | 0.095 | 0.000 | 0.000 | ||
| 3 spectra, EEELVSER | 0.000 | 0.375 | 0.517 | 0.108 | 0.000 | 0.000 | 0.000 | 0.000 | ||
| 2 spectra, YALLDECTSAVSIDVEGK | 0.000 | 0.000 | 0.641 | 0.359 | 0.000 | 0.000 | 0.000 | 0.000 | ||
| 7 spectra, VSNMDGR | 0.000 | 0.248 | 0.461 | 0.152 | 0.005 | 0.000 | 0.133 | 0.000 | ||
| 3 spectra, QCLTPAR | 0.000 | 0.000 | 0.817 | 0.000 | 0.000 | 0.000 | 0.183 | 0.000 | ||
| 6 spectra, NLLTAAADATER | 0.000 | 0.371 | 0.460 | 0.170 | 0.000 | 0.000 | 0.000 | 0.000 | ||
| 3 spectra, MFYHRPK | 0.000 | 0.137 | 0.671 | 0.192 | 0.000 | 0.000 | 0.000 | 0.000 | ||
| 14 spectra, PVLSTPSRPSR | 0.000 | 0.198 | 0.702 | 0.100 | 0.000 | 0.000 | 0.000 | 0.000 |
| Plot | Mito | Lyso or Perox | ER | Golgi | PM | Cytosol | Nucleus | ||||||
| Expt B |
15 peptides |
34 spectra |
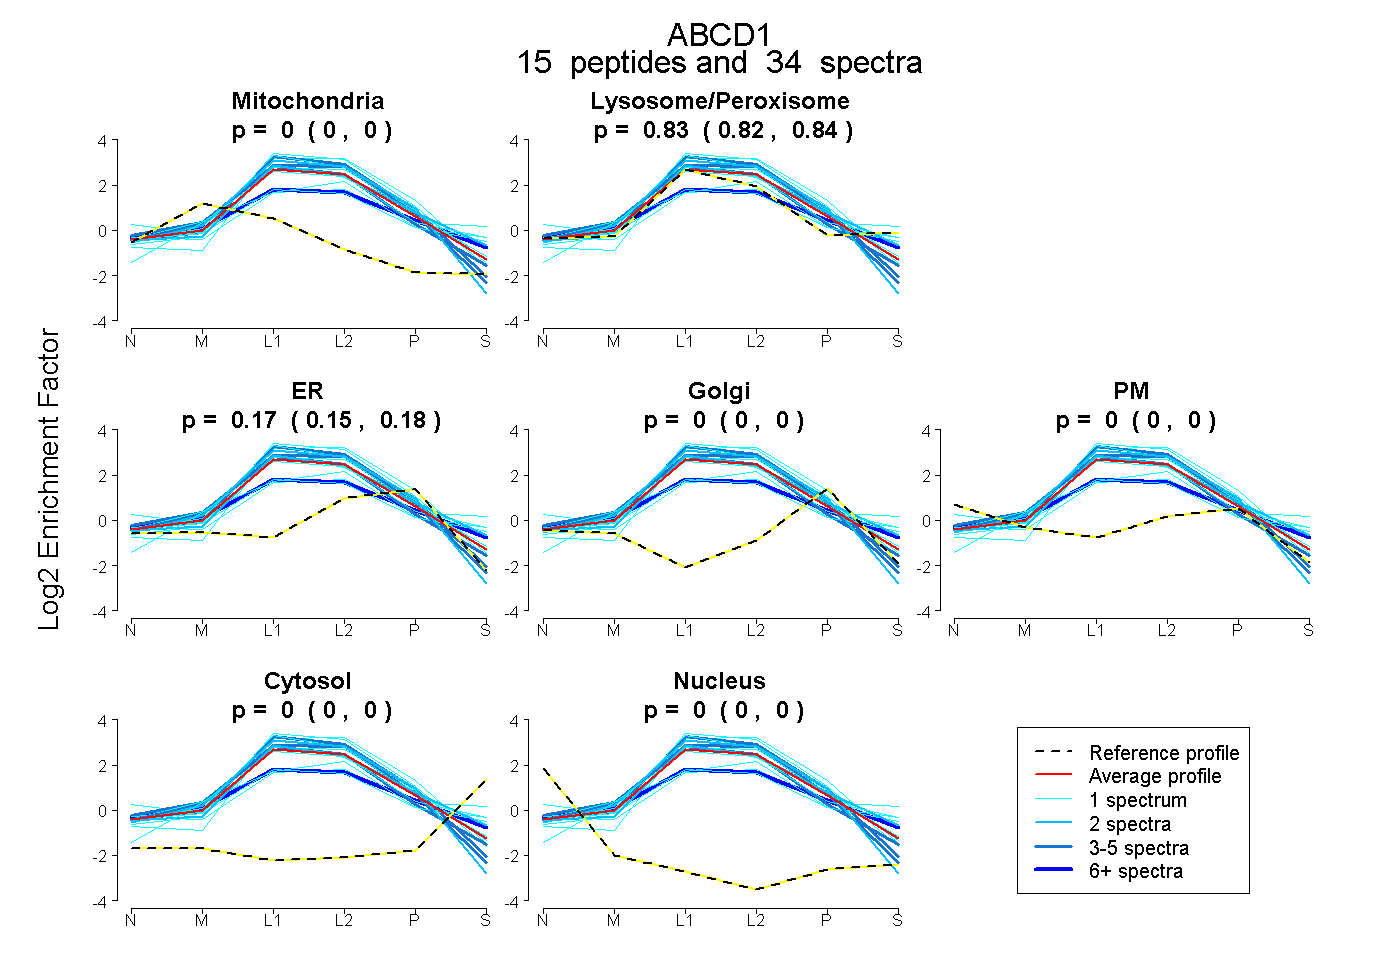 |
0.000 0.000 | 0.000 |
0.833 0.820 | 0.843 |
0.167 0.154 | 0.178 |
0.000 0.000 | 0.000 |
0.000 0.000 | 0.000 |
0.000 0.000 | 0.000 |
0.000 0.000 | 0.000 |
|||
| Plot | Lyso | Other | |||||||||||
| Expt C |
29 peptides |
249 spectra |
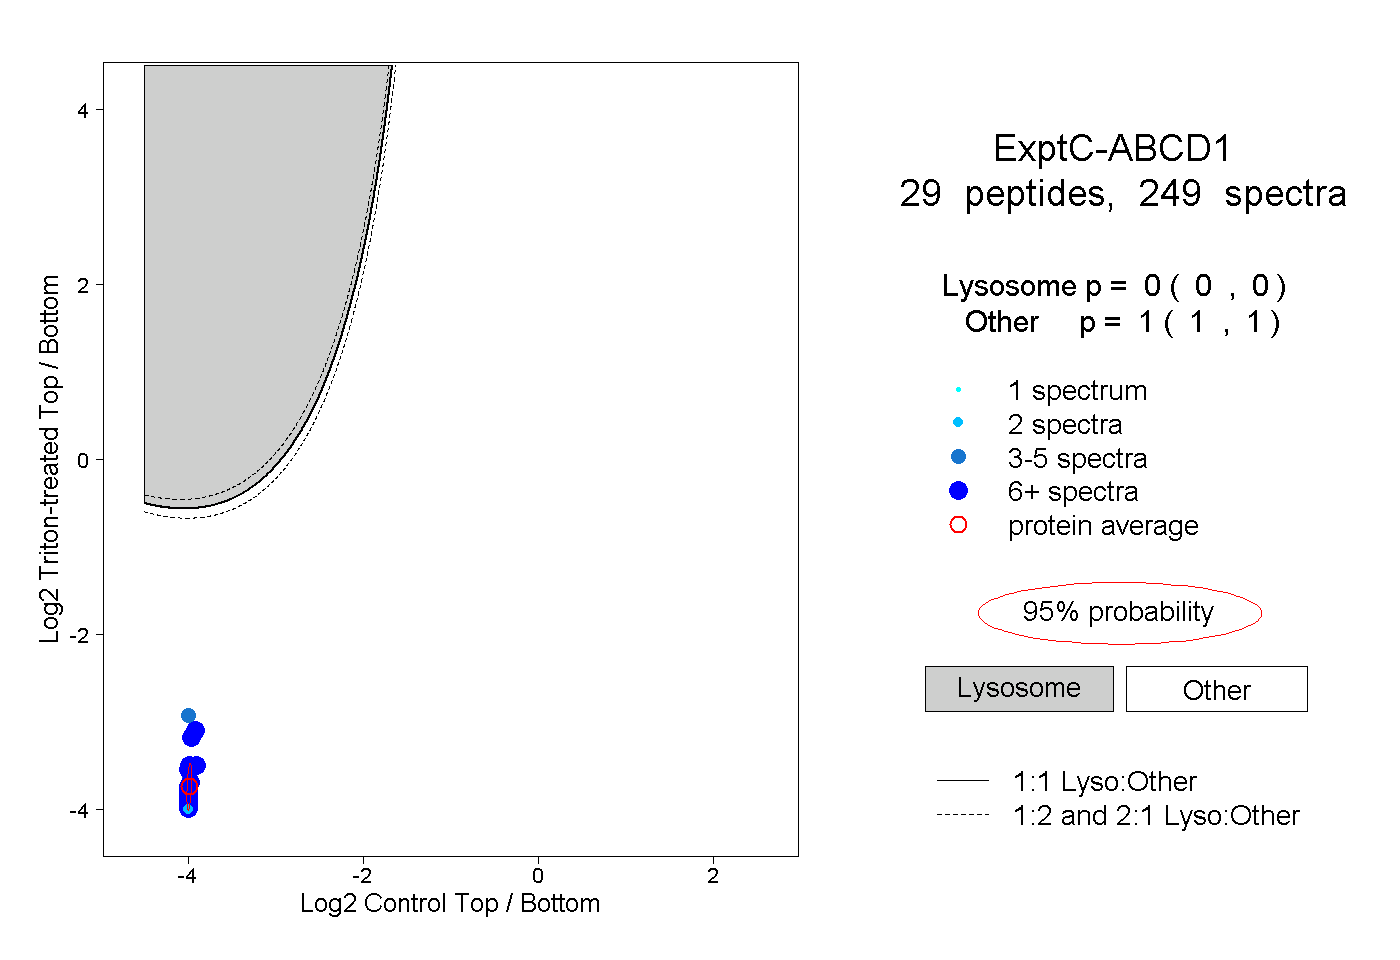 |
0.000 0.000 | 0.000 |
1.000 1.000 | 1.000 |
||||||||
| Plot | Lyso | Other | |||||||||||
| Expt D |
13 peptides |
24 spectra |
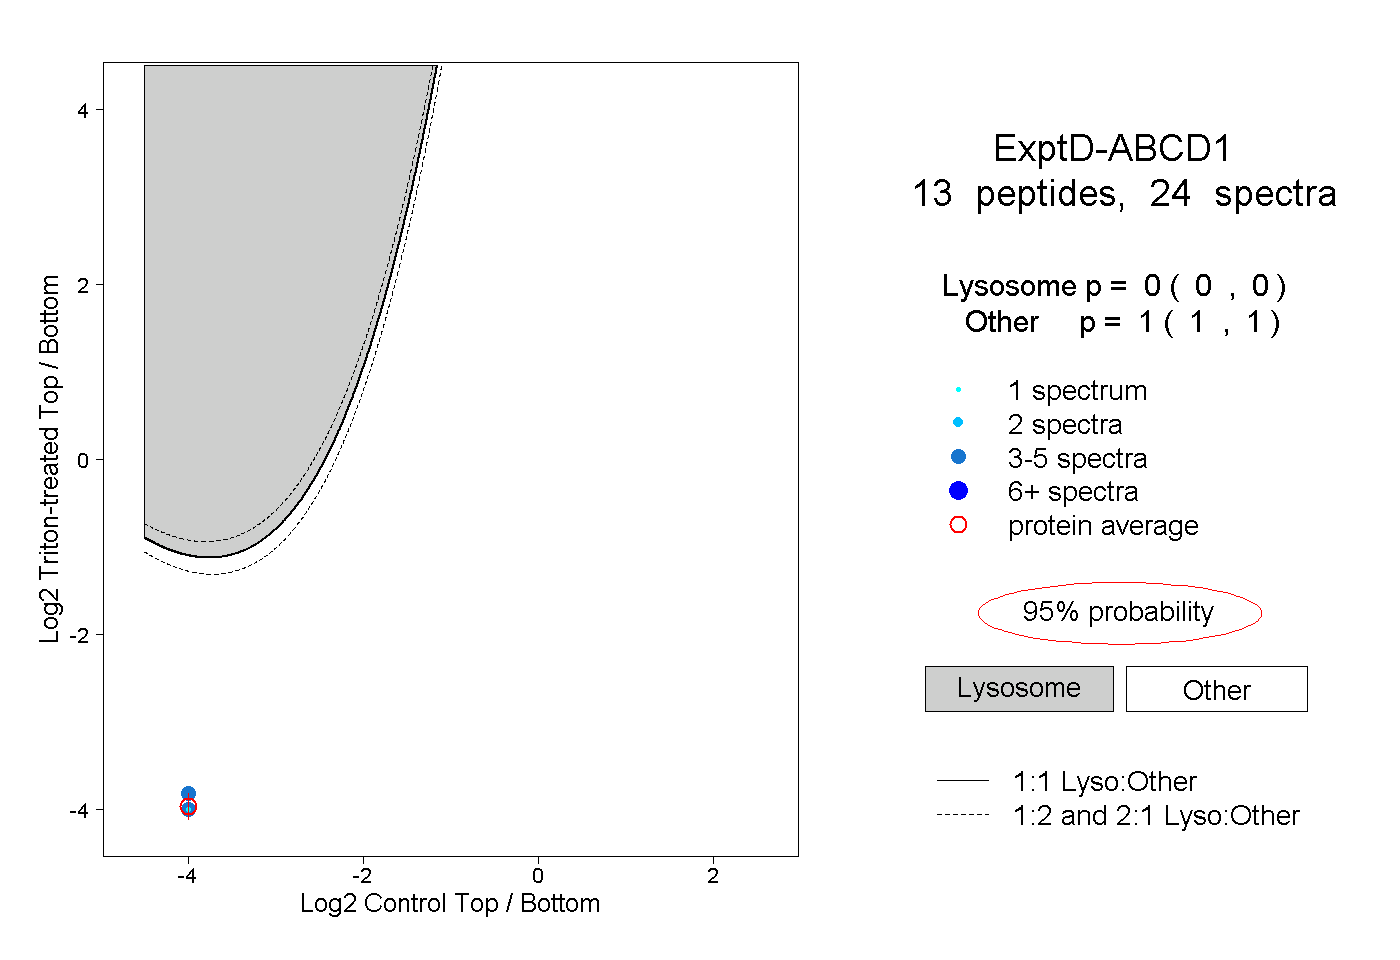 |
0.000 0.000 | 0.000 |
1.000 1.000 | 1.000 |