9
9peptides
spectra
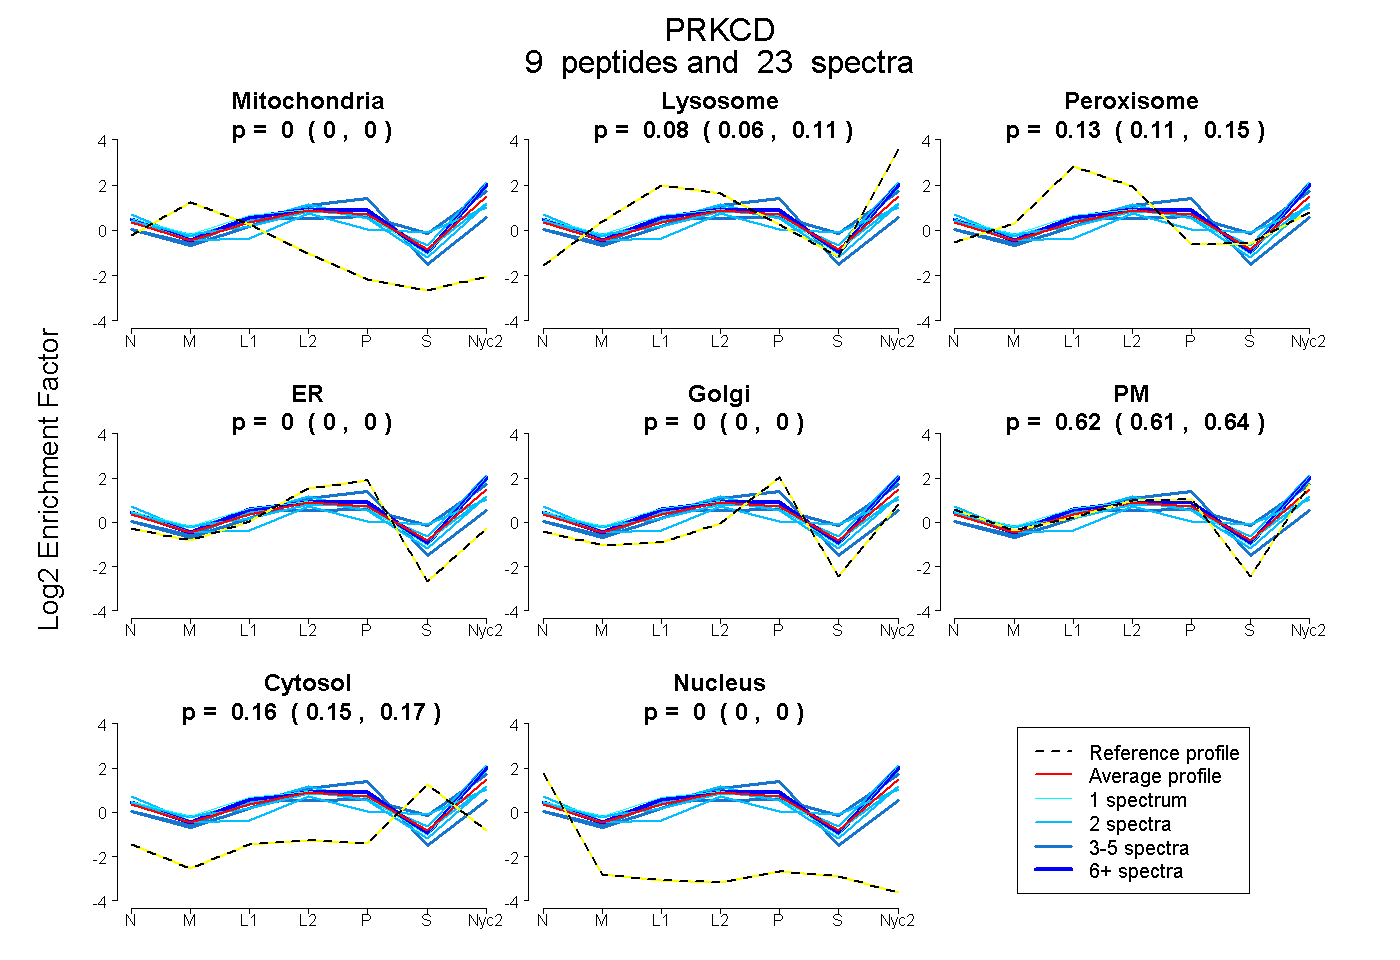
0.000 | 0.000
0.056 | 0.106
0.110 | 0.150
0.000 | 0.000
0.000 | 0.000
0.606 | 0.636
0.155 | 0.168
0.000 | 0.000
3peptides
spectra
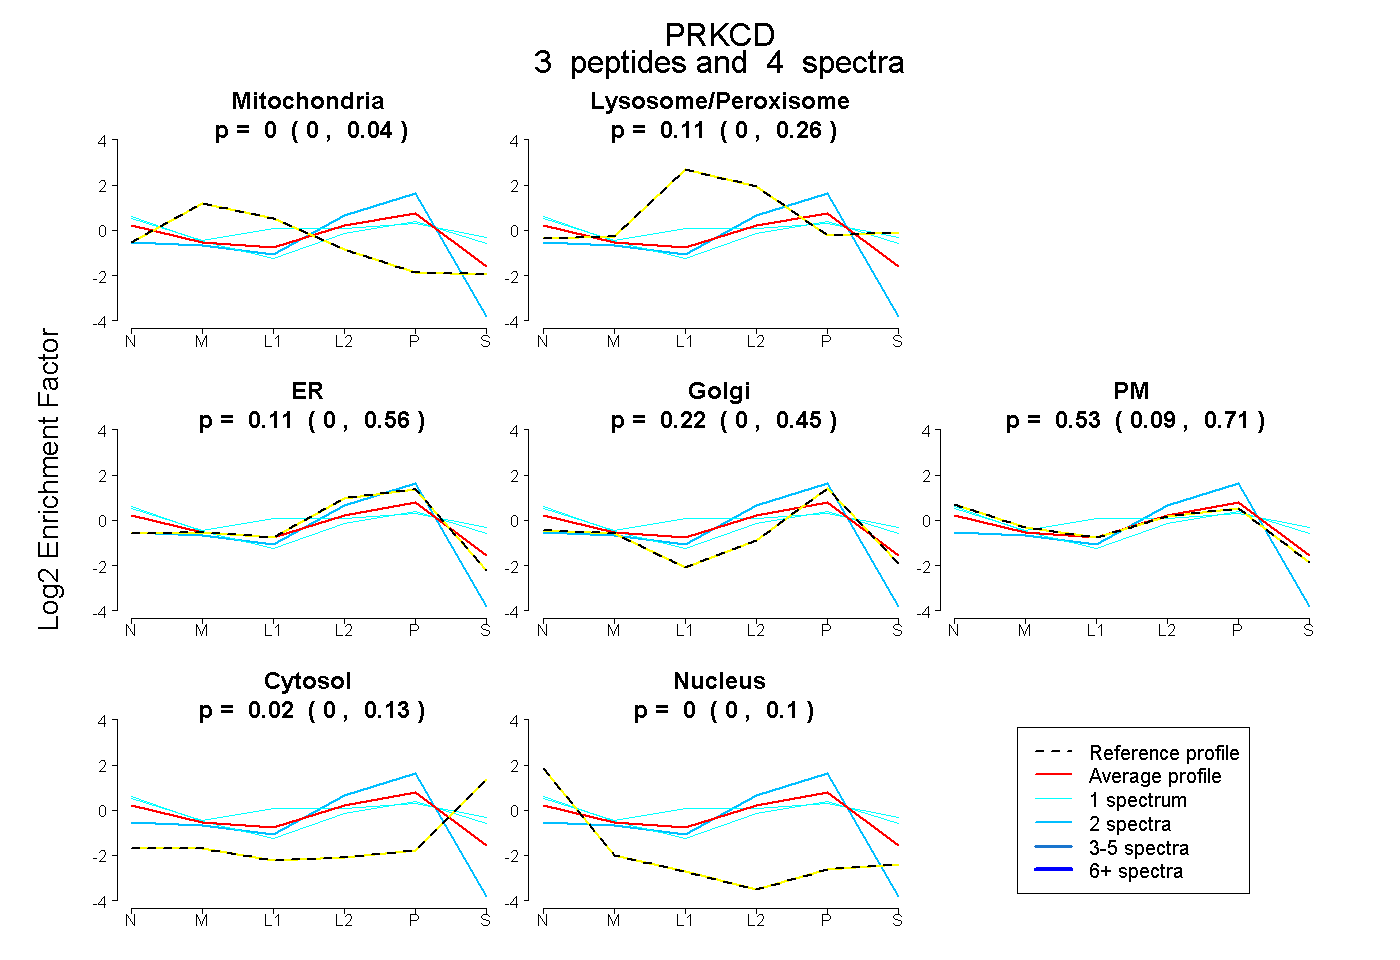
0.000 | 0.039
0.000 | 0.258
0.000 | 0.557
0.000 | 0.451
0.089 | 0.707
0.000 | 0.127
0.000 | 0.102
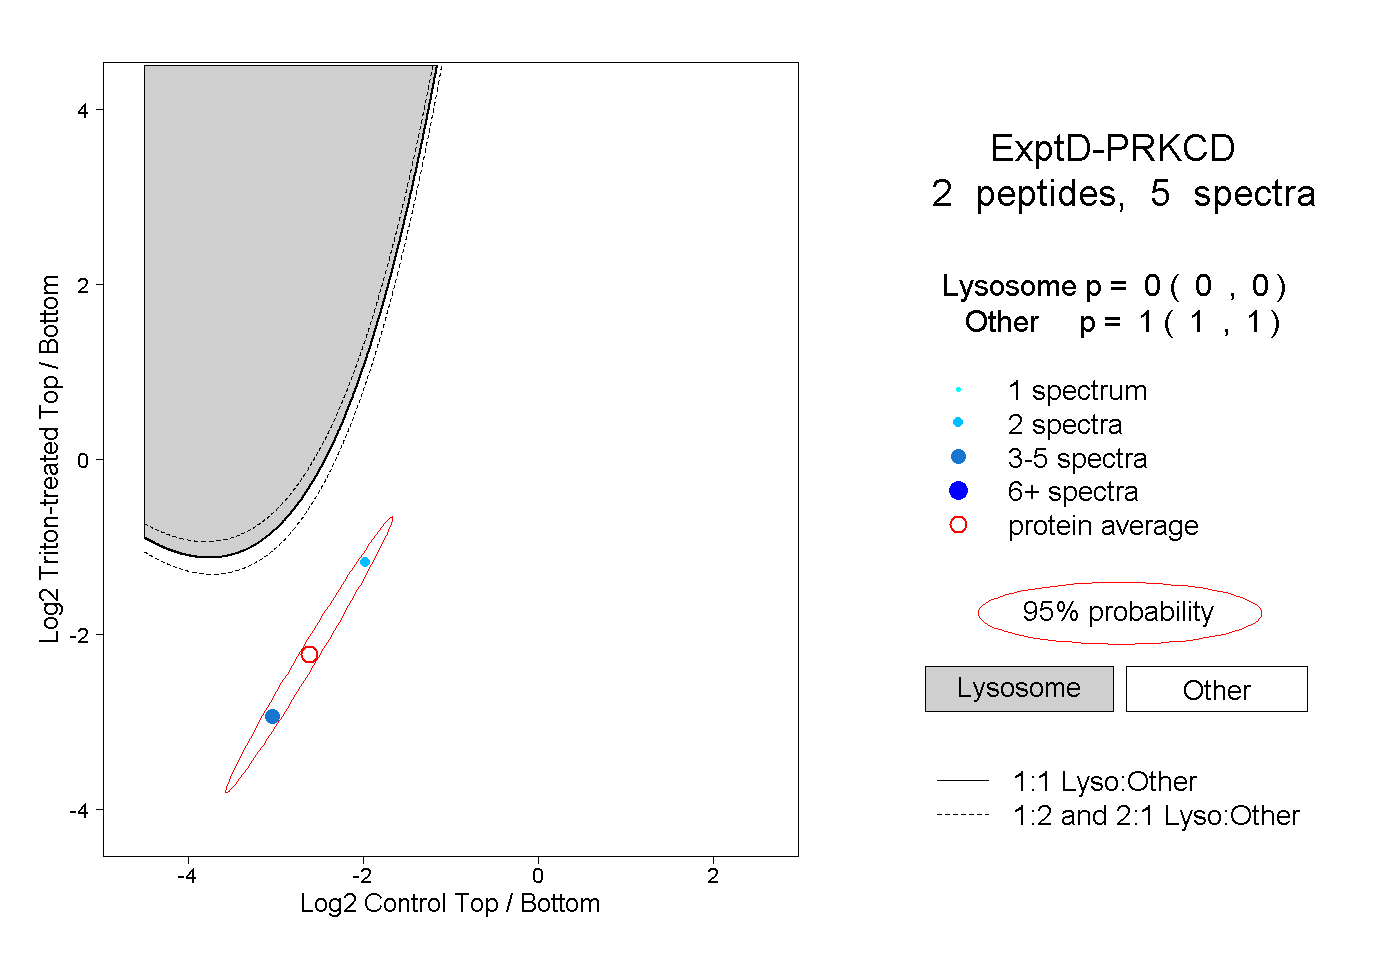
15peptides
spectra
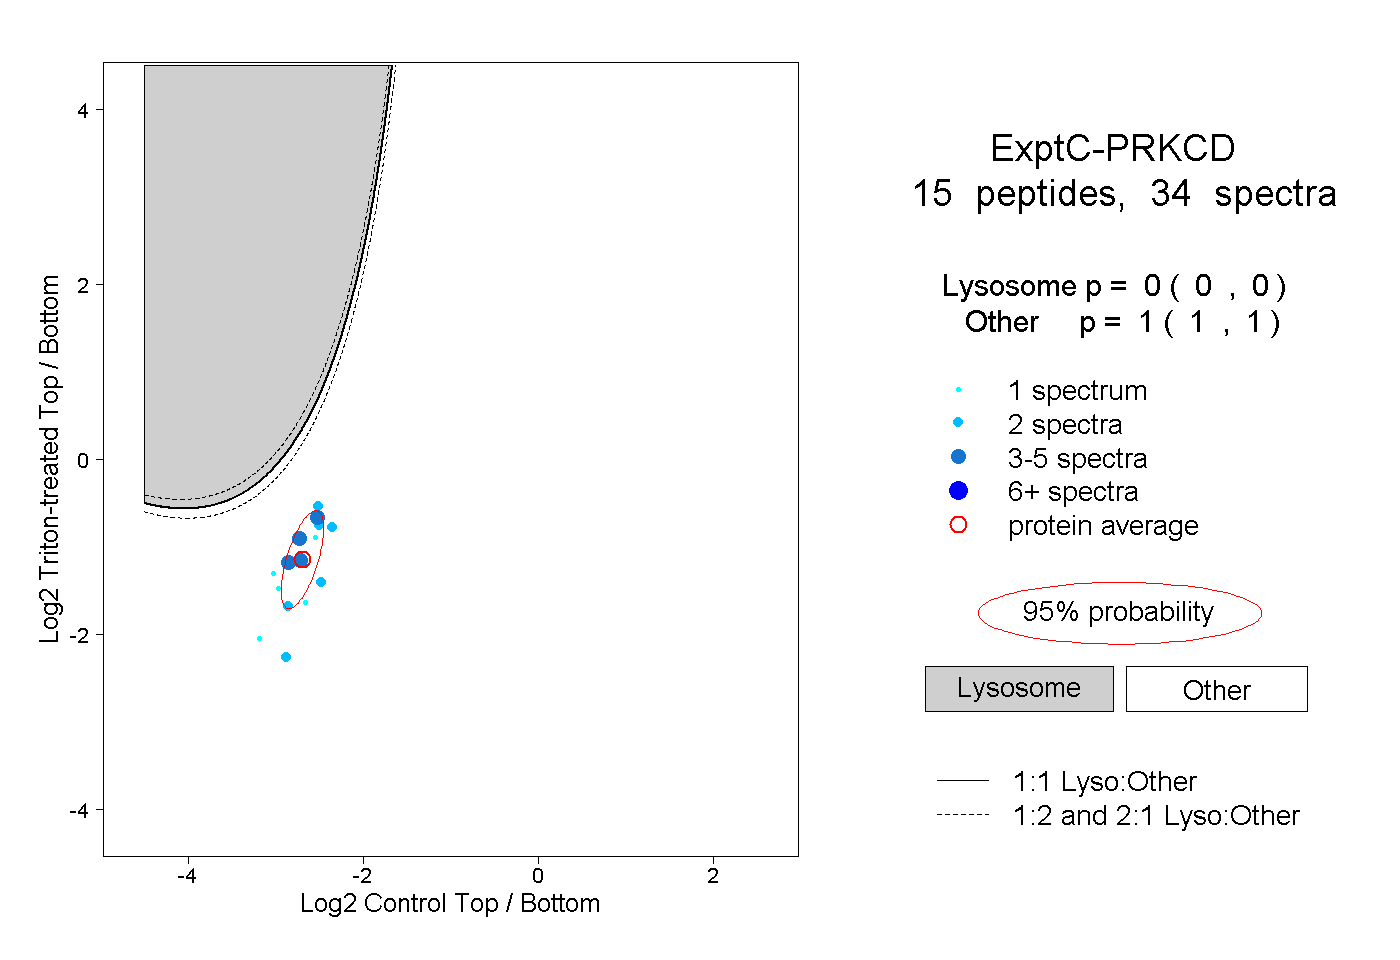
0.000 | 0.000
1.000 | 1.000