PRKCD
[ENSRNOP00000025858]
Main page
| | | Plot |
Mito |
Lyso |
|
Perox |
ER |
Golgi |
PM |
Cytosol |
Nucleus |
|
| Expt A |
 9
9
peptides |
23
spectra |
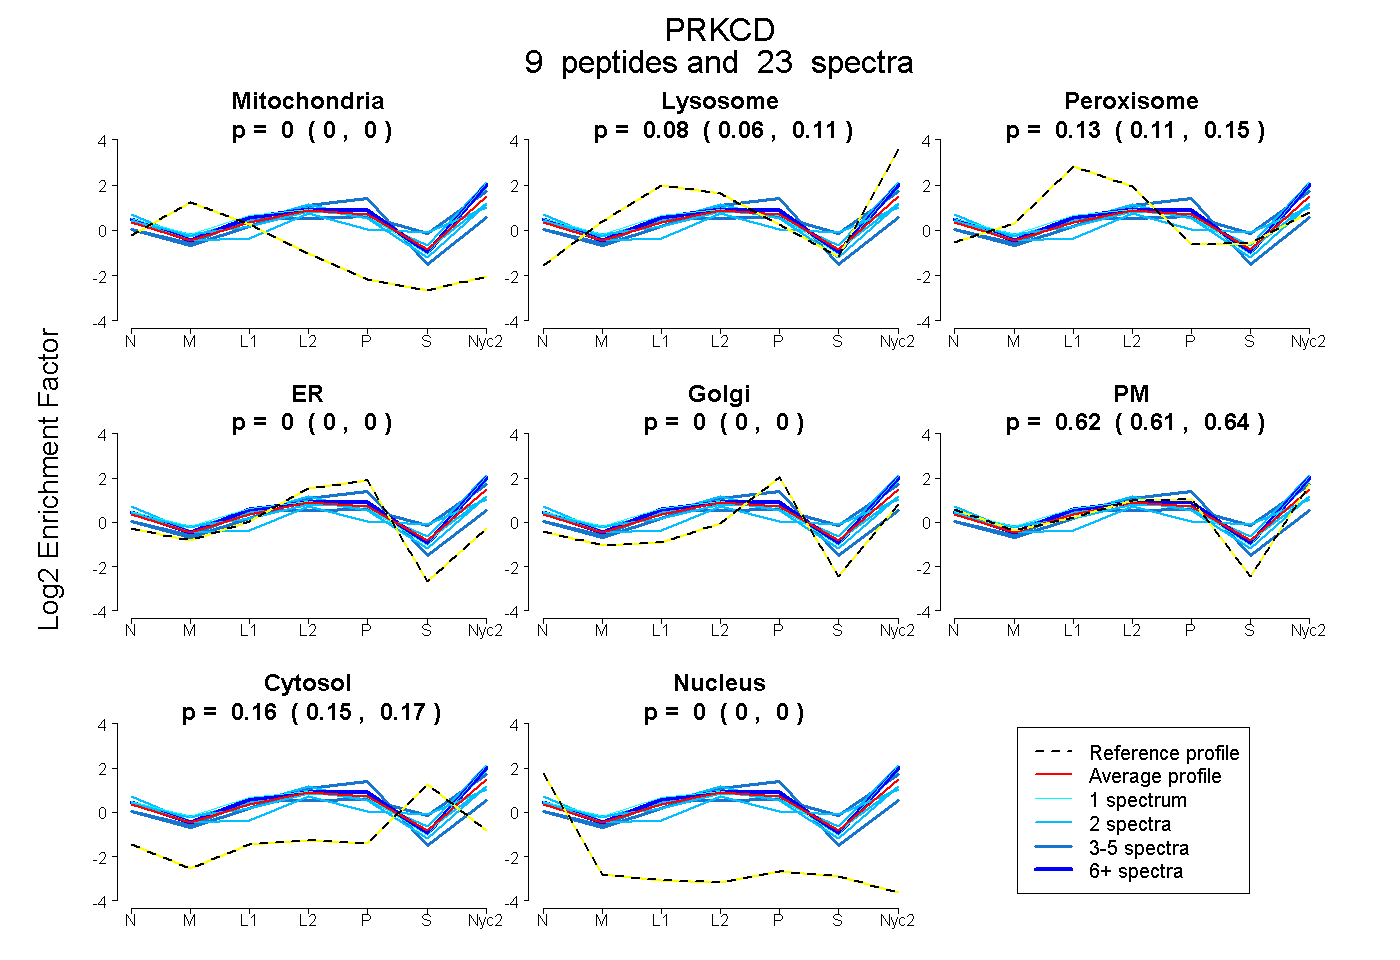 |
0.000
0.000 | 0.000 |
0.084
0.056 | 0.106 |
|
0.131
0.110 | 0.150 |
0.000
0.000 | 0.000 |
0.000
0.000 | 0.000 |
0.623
0.606 | 0.636 |
0.162
0.155 | 0.168 |
0.000
0.000 | 0.000 |
|
| | | Plot |
Mito |
|
Lyso or Perox |
|
ER |
Golgi |
PM |
Cytosol |
Nucleus |
|
| Expt B |
3
peptides |
4
spectra |
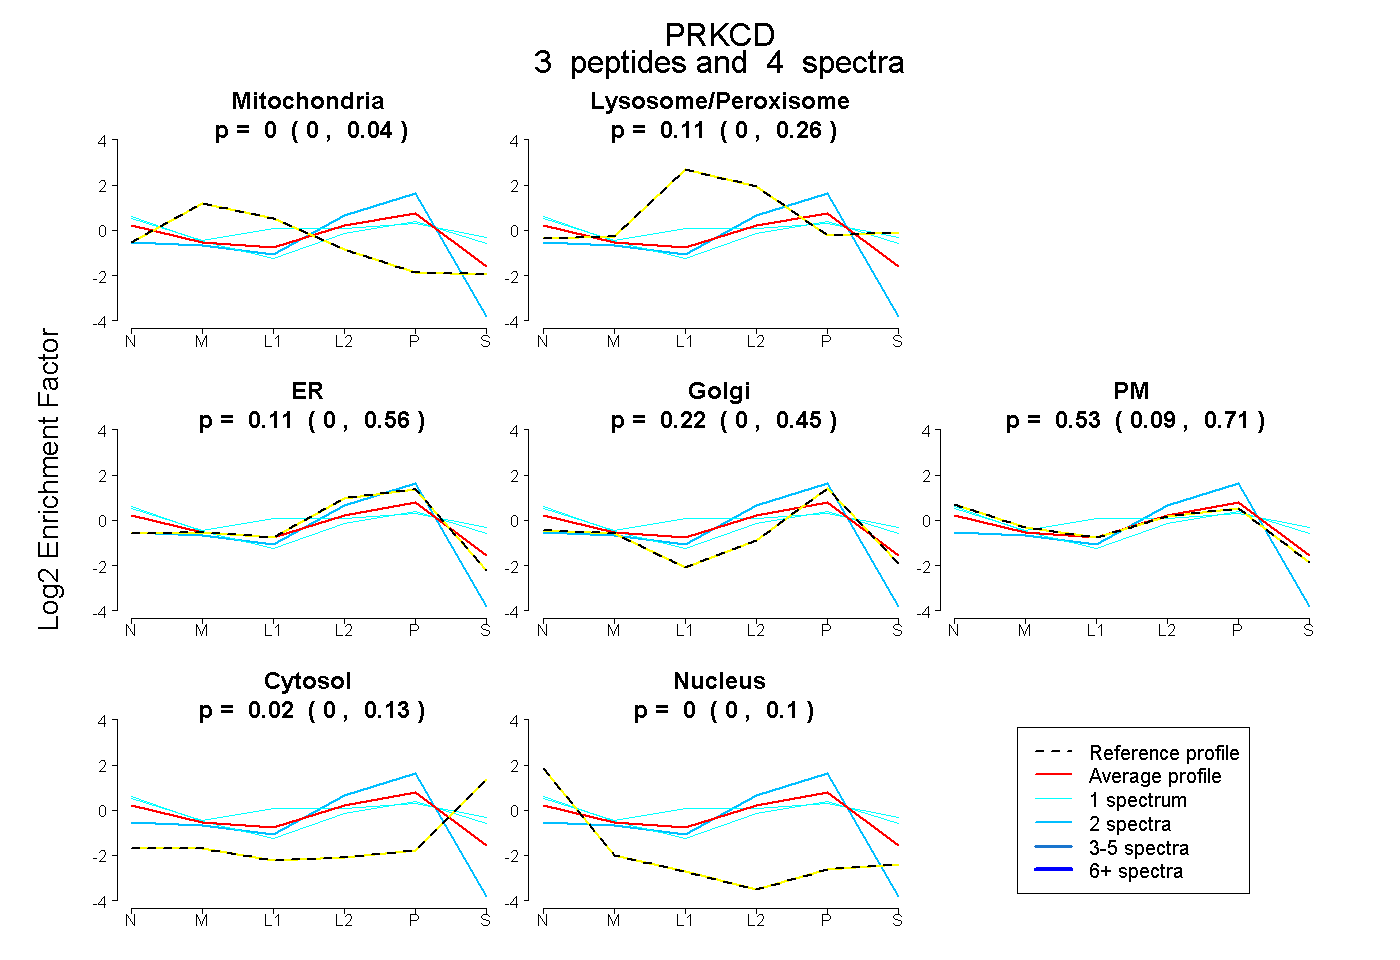 |
0.000
0.000 | 0.039 |
|
0.110
0.000 | 0.258 |
|
0.114
0.000 | 0.557 |
0.224
0.000 | 0.451 |
0.531
0.089 | 0.707 |
0.022
0.000 | 0.127 |
0.000
0.000 | 0.102 |
|
| 2 spectra, APFLR |
0.000 |
|
0.000 |
|
0.915 |
0.068 |
0.000 |
0.000 |
0.017 |
|
| 1 spectrum, LHPFFK |
0.000 |
|
0.291 |
|
0.000 |
0.000 |
0.551 |
0.158 |
0.000 |
|
| 1 spectrum, LLAEALNQVTQK |
0.000 |
|
0.008 |
|
0.000 |
0.000 |
0.785 |
0.207 |
0.000 |
|
| | | Plot |
|
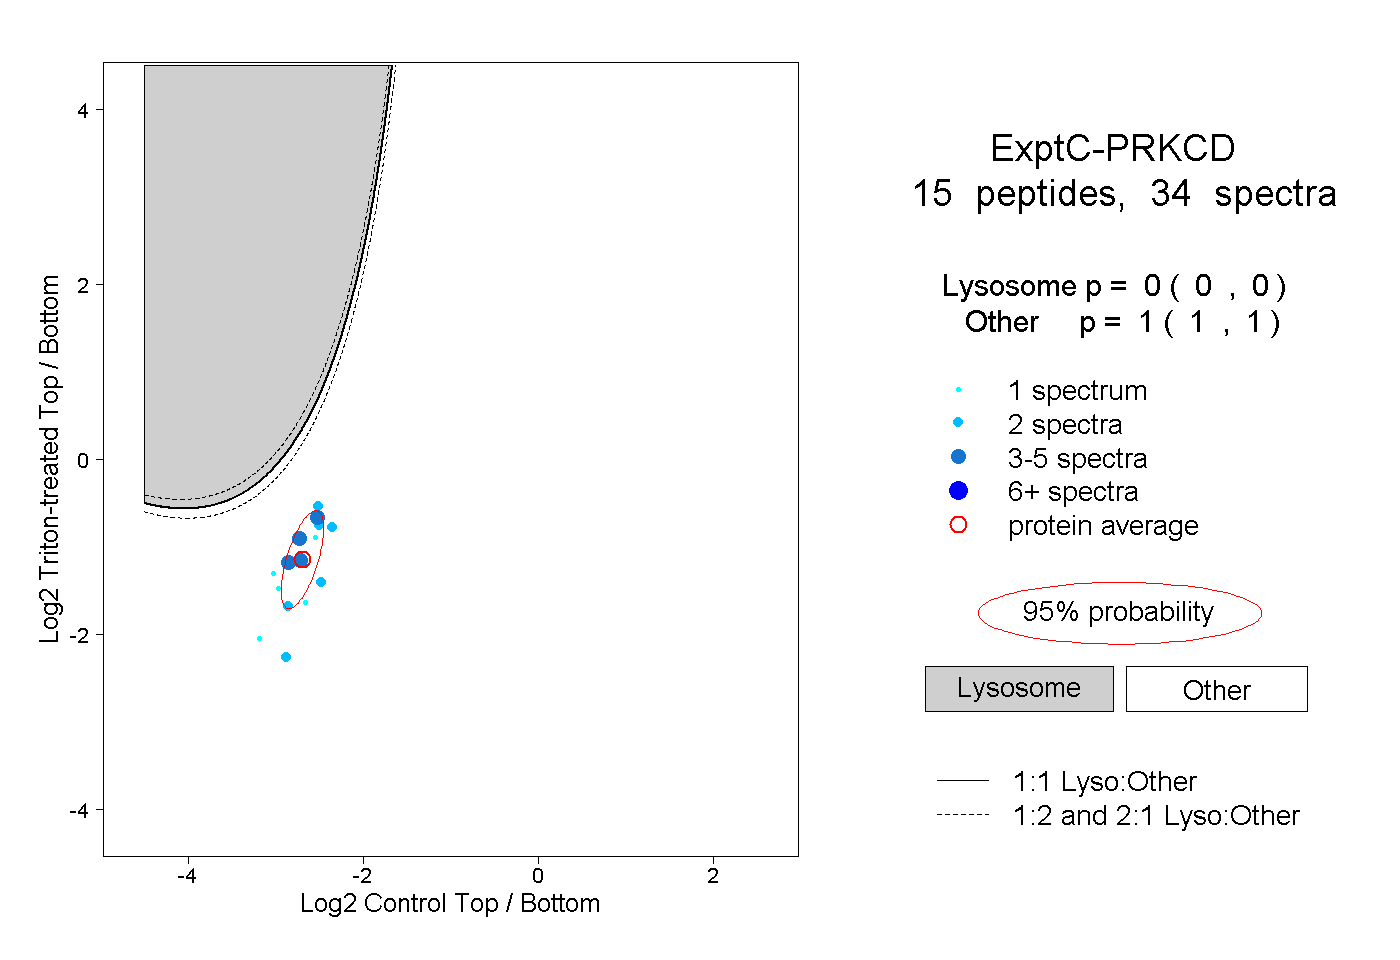
Lyso |
|
|
|
|
|
|
|
Other |
| Expt C |
15
peptides |
34
spectra |
 |
|
0.000
0.000 | 0.000 |
|
|
|
|
|
|
|
1.000
1.000 | 1.000 |
| | | Plot |
|
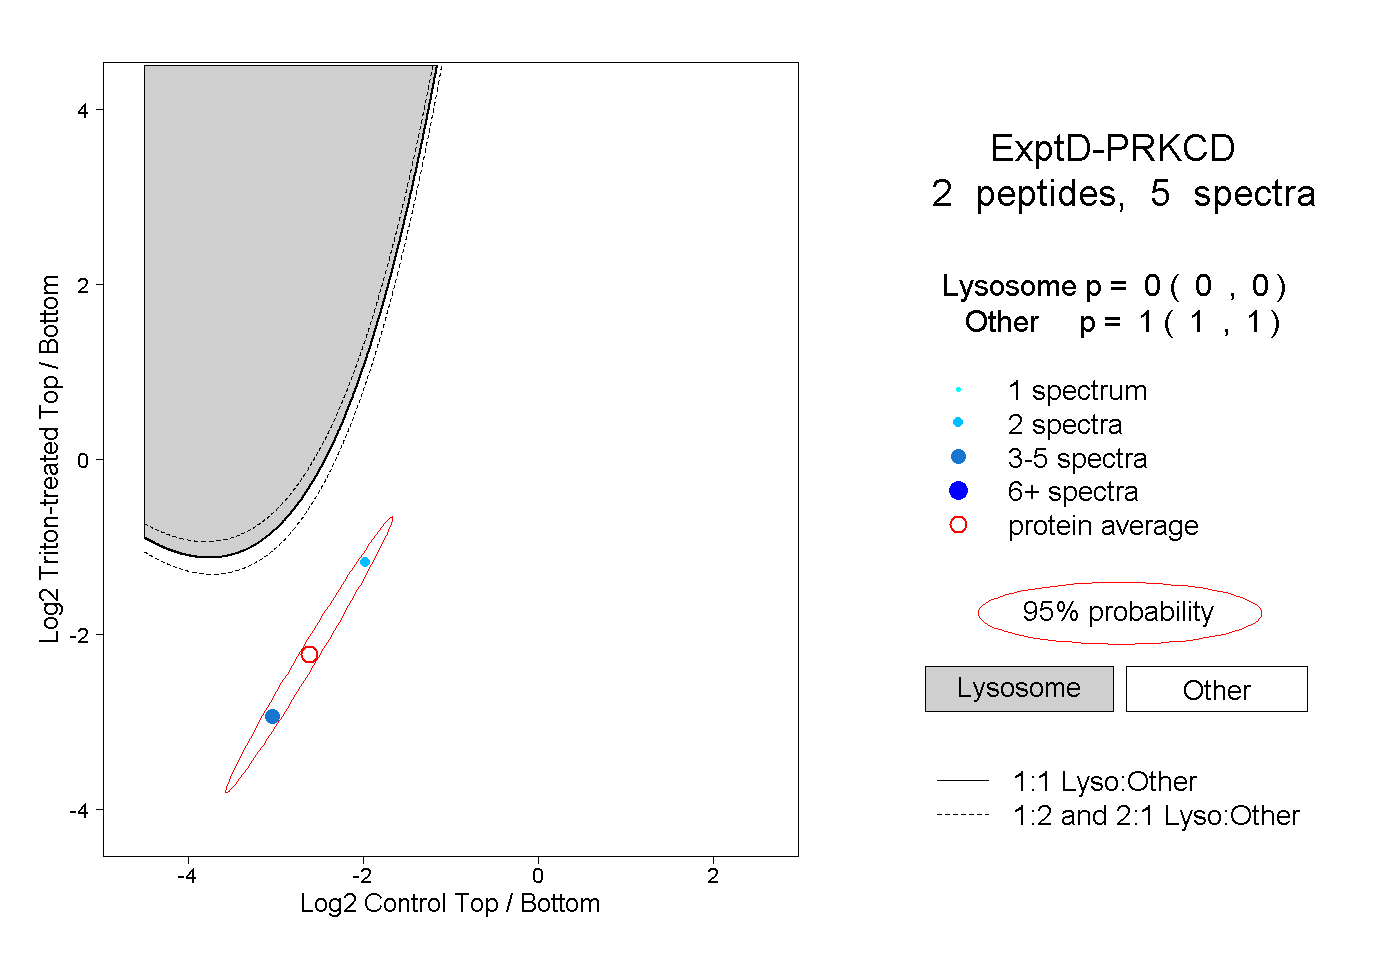
Lyso |
|
|
|
|
|
|
|
Other |
| Expt D |
2
peptides |
5
spectra |
 |
|
0.000
0.000 | 0.000 |
|
|
|
|
|
|
|
1.000
1.000 | 1.000 |