 9
9peptides
spectra
0.000 | 0.000
0.056 | 0.106
0.110 | 0.150
0.000 | 0.000
0.000 | 0.000
0.606 | 0.636
0.155 | 0.168
0.000 | 0.000
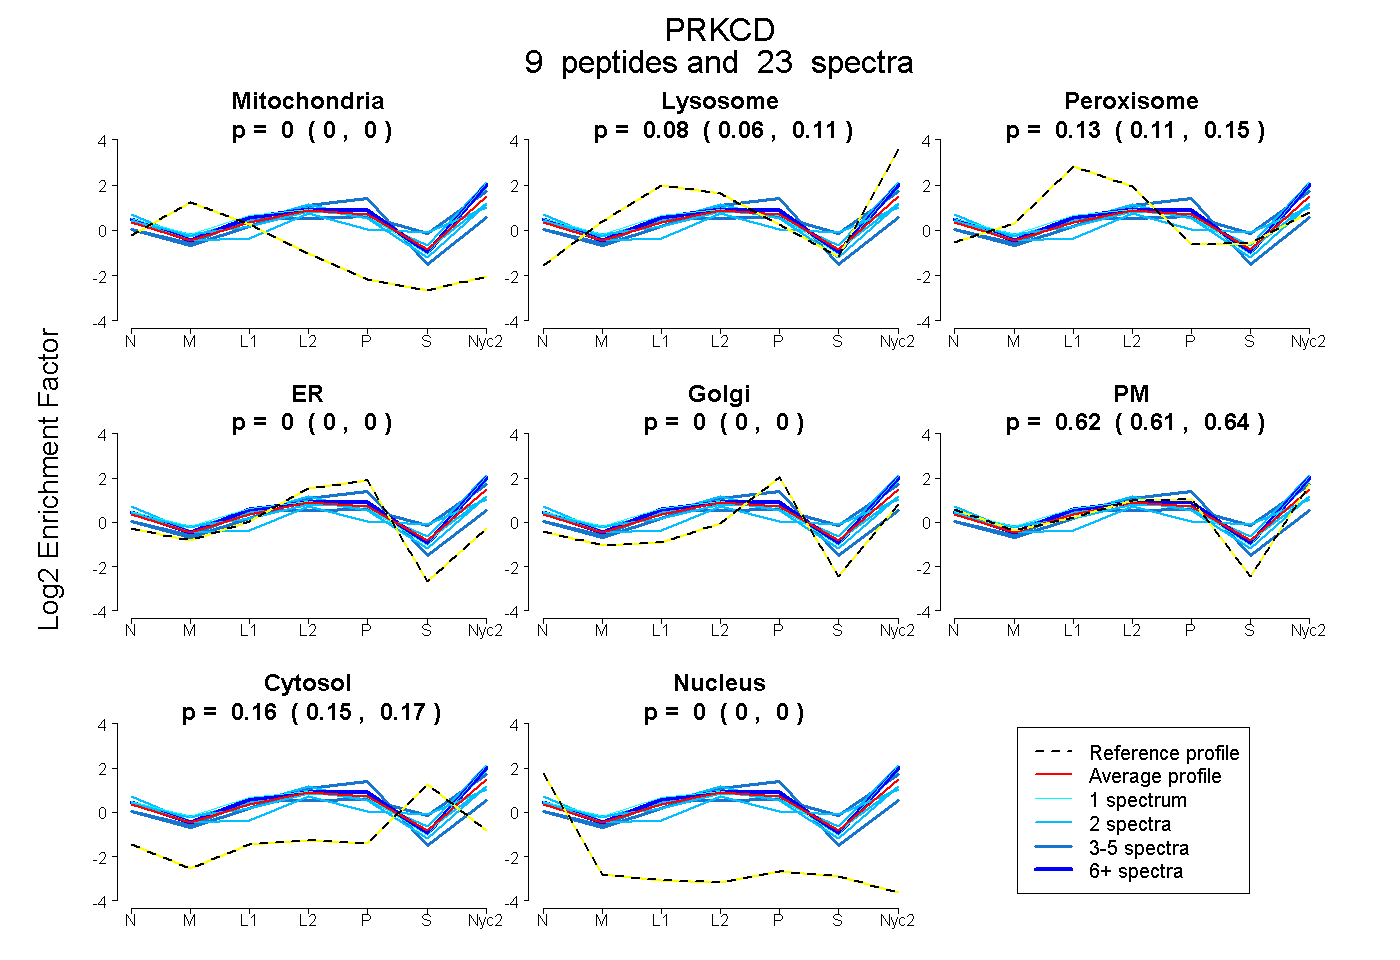
| Plot | Mito | Lyso | Perox | ER | Golgi | PM | Cytosol | Nucleus | |||||
| Expt A |
9 peptides |
23 spectra |
|
0.000 0.000 | 0.000 |
0.084 0.056 | 0.106 |
0.131 0.110 | 0.150 |
0.000 0.000 | 0.000 |
0.000 0.000 | 0.000 |
0.623 0.606 | 0.636 |
0.162 0.155 | 0.168 |
0.000 0.000 | 0.000 |
| 6 spectra, LHPFFK | 0.000 | 0.205 | 0.053 | 0.000 | 0.000 | 0.636 | 0.106 | 0.000 | ||
| 2 spectra, LGVTGNIR | 0.000 | 0.252 | 0.073 | 0.000 | 0.000 | 0.536 | 0.138 | 0.000 | ||
| 3 spectra, ENIFGENR | 0.000 | 0.267 | 0.075 | 0.000 | 0.000 | 0.400 | 0.258 | 0.000 | ||
| 2 spectra, CEDCGMNVHHK | 0.000 | 0.000 | 0.204 | 0.000 | 0.000 | 0.683 | 0.113 | 0.000 | ||
| 4 spectra, APFLR | 0.000 | 0.000 | 0.135 | 0.361 | 0.132 | 0.282 | 0.089 | 0.000 | ||
| 1 spectrum, AEFWLDLQPQAK | 0.000 | 0.165 | 0.079 | 0.000 | 0.000 | 0.642 | 0.114 | 0.000 | ||
| 1 spectrum, VLLAELK | 0.000 | 0.206 | 0.090 | 0.000 | 0.000 | 0.622 | 0.082 | 0.000 | ||
| 2 spectra, SEEEAMFPTMNR | 0.000 | 0.000 | 0.157 | 0.000 | 0.000 | 0.521 | 0.321 | 0.000 | ||
| 2 spectra, QCNAAIHK | 0.000 | 0.003 | 0.172 | 0.000 | 0.000 | 0.656 | 0.169 | 0.000 |
| Plot | Mito | Lyso or Perox | ER | Golgi | PM | Cytosol | Nucleus | ||||||
| Expt B |
3 peptides |
4 spectra |
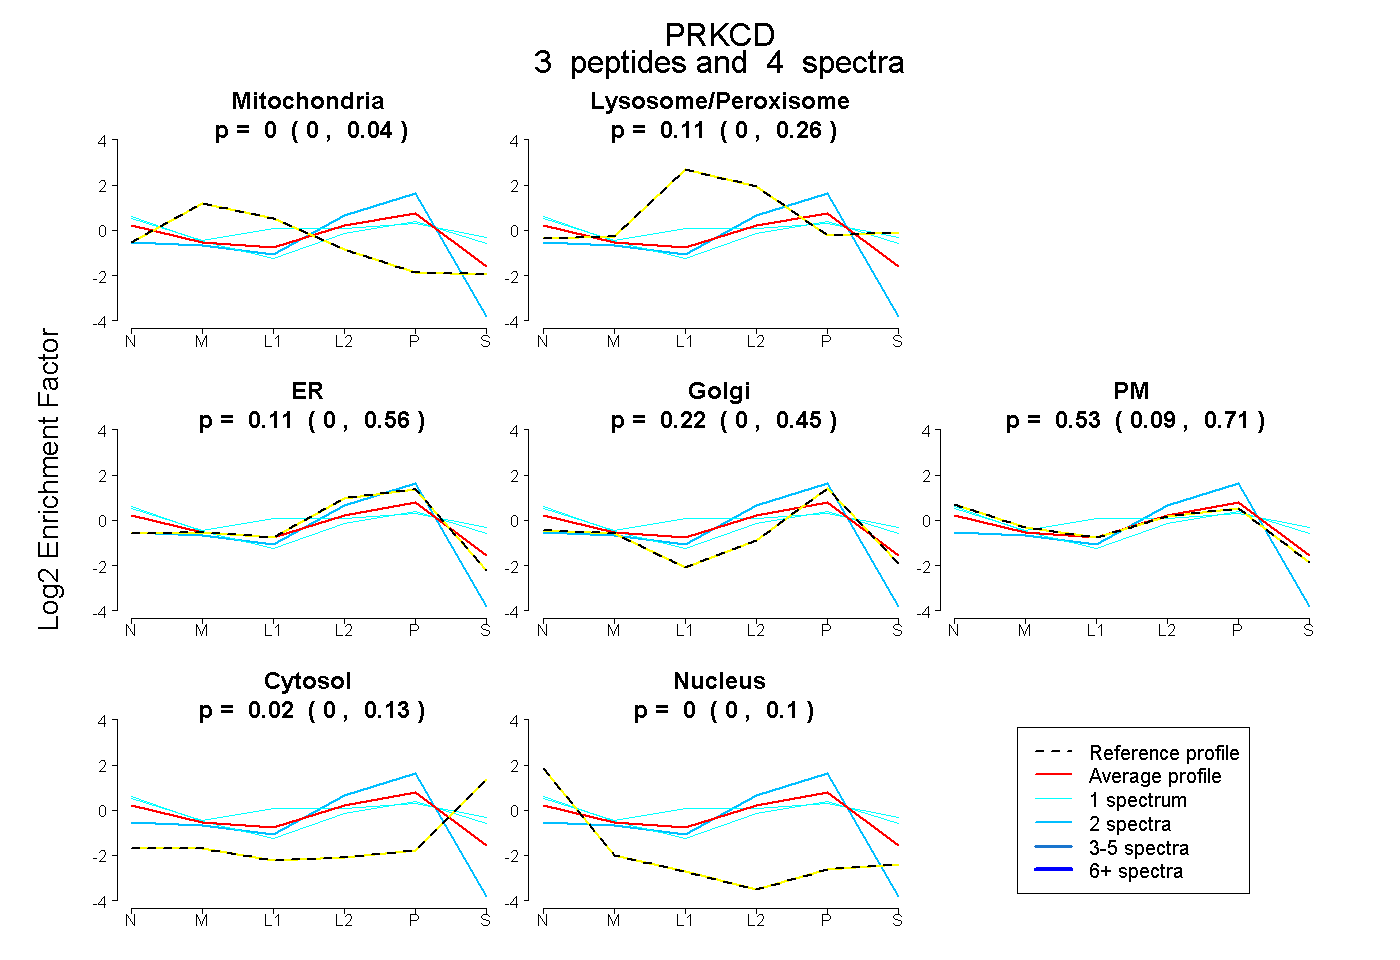 |
0.000 0.000 | 0.039 |
0.110 0.000 | 0.258 |
0.114 0.000 | 0.557 |
0.224 0.000 | 0.451 |
0.531 0.089 | 0.707 |
0.022 0.000 | 0.127 |
0.000 0.000 | 0.102 |
|||
| Plot | Lyso | Other | |||||||||||
| Expt C |
15 peptides |
34 spectra |
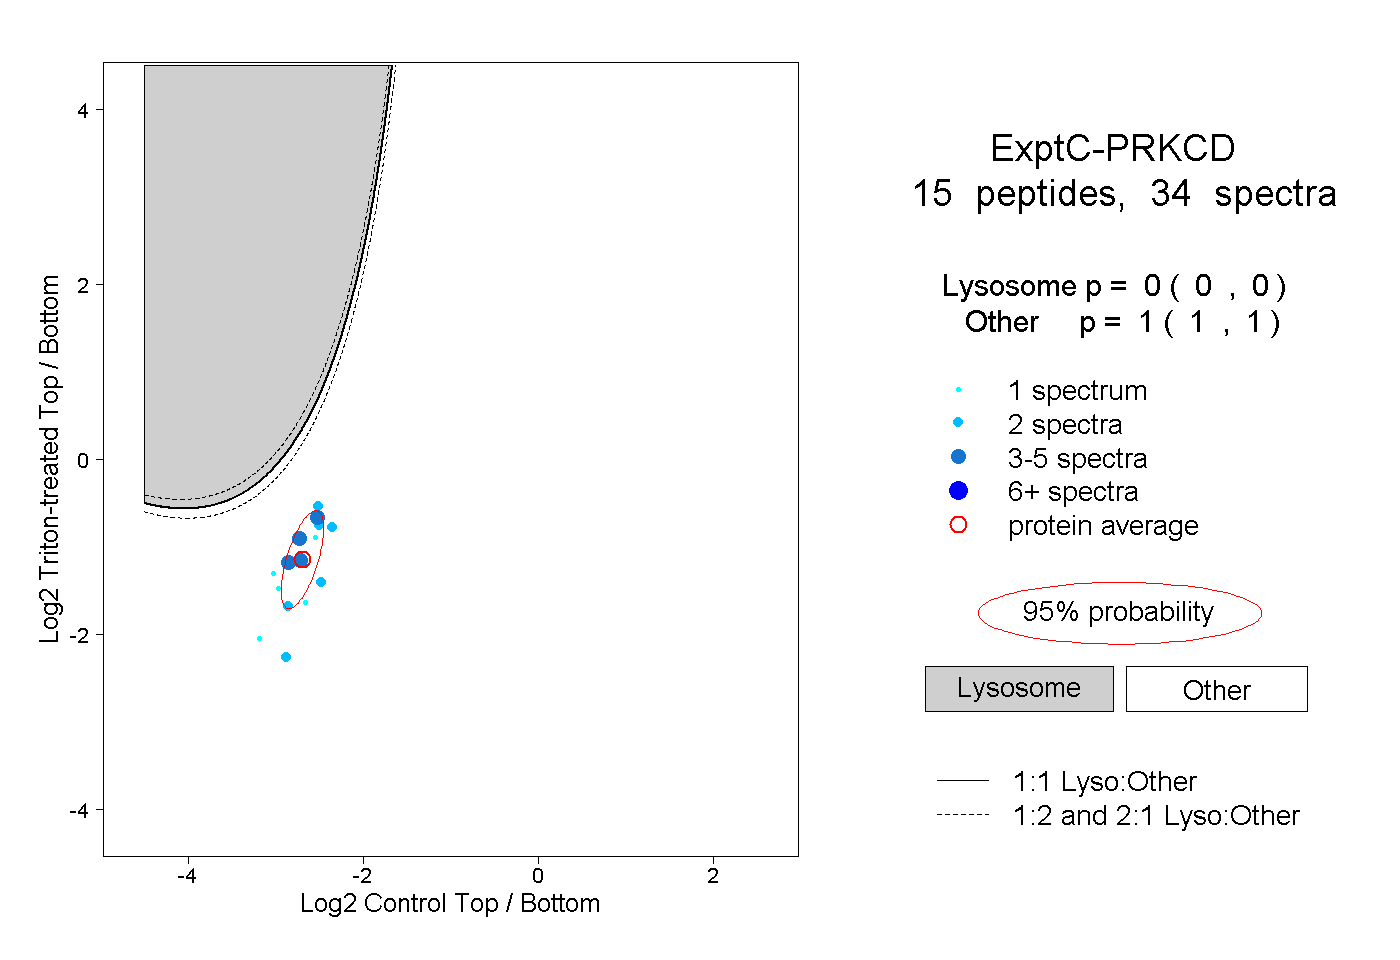 |
0.000 0.000 | 0.000 |
1.000 1.000 | 1.000 |
||||||||
| Plot | Lyso | Other | |||||||||||
| Expt D |
2 peptides |
5 spectra |
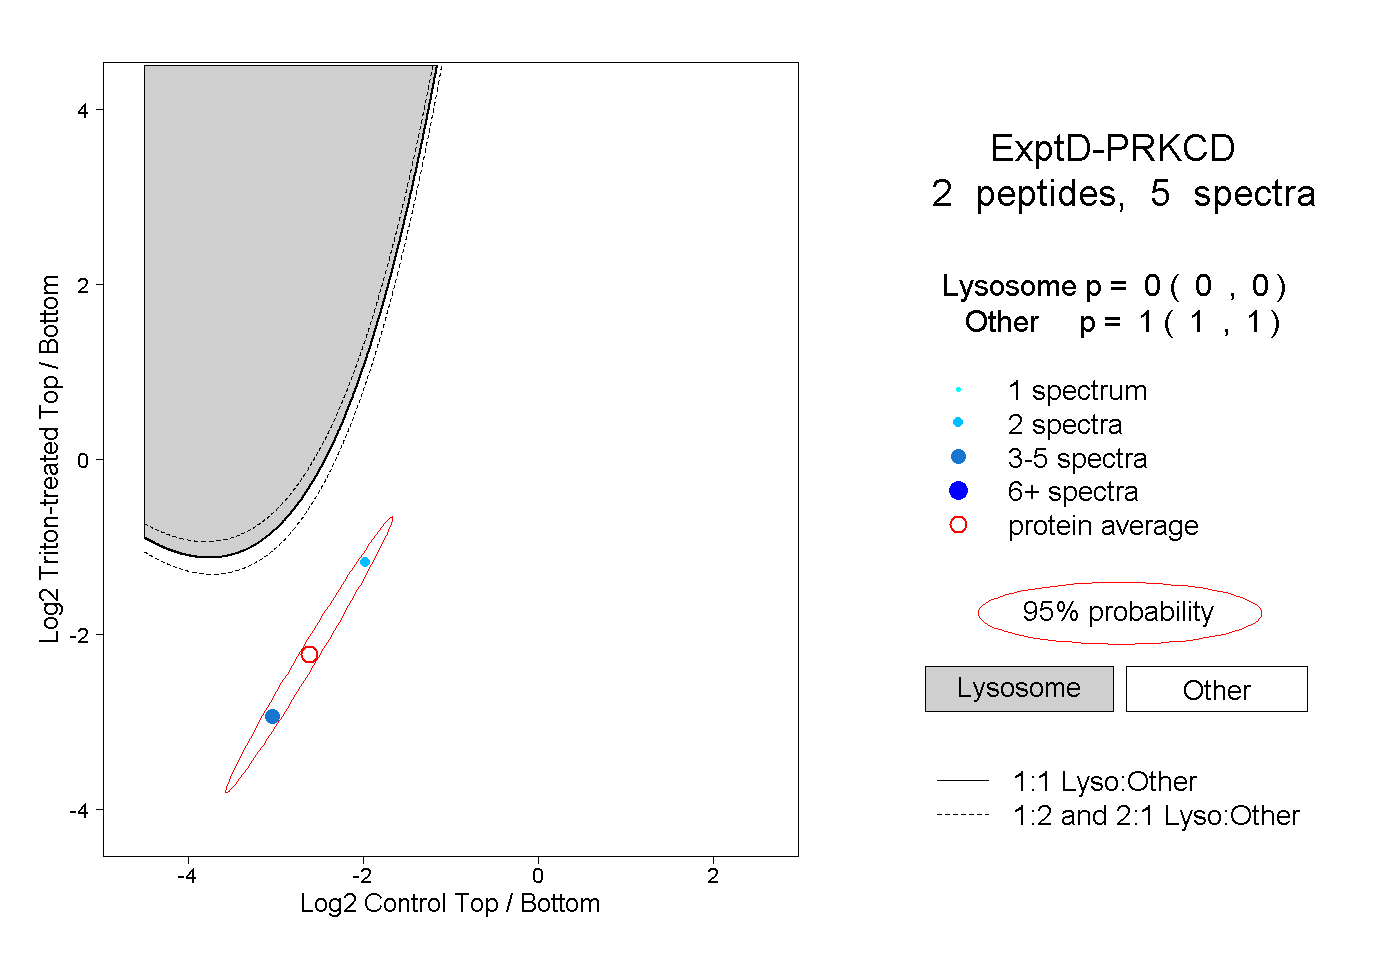 |
0.000 0.000 | 0.000 |
1.000 1.000 | 1.000 |