6
6peptides
spectra
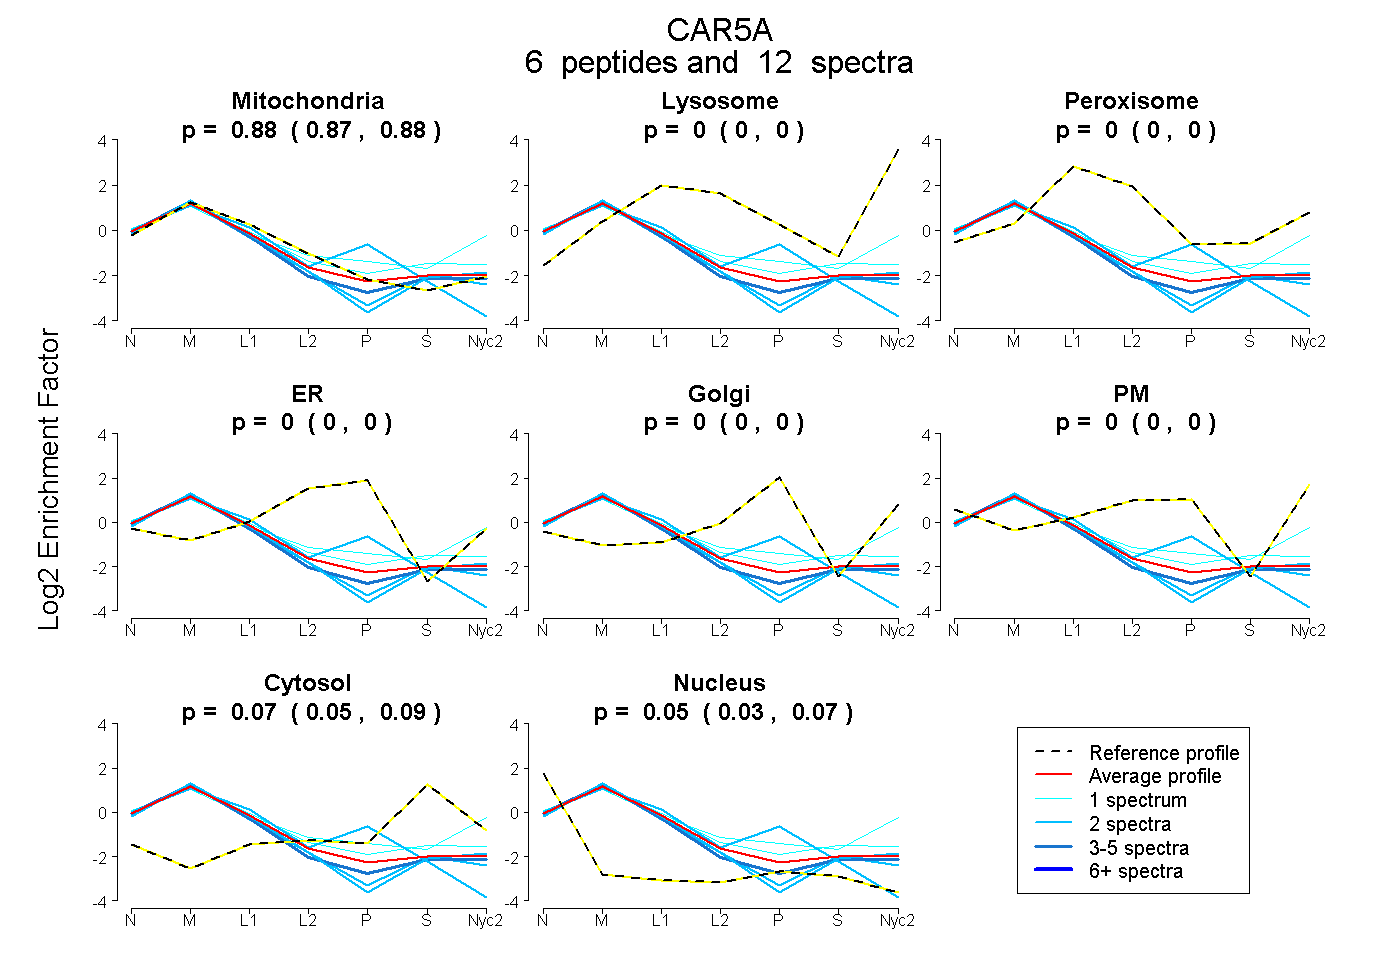
0.869 | 0.882
0.000 | 0.000
0.000 | 0.000
0.000 | 0.000
0.000 | 0.000
0.000 | 0.000
0.050 | 0.089
0.032 | 0.070
5peptides
spectra
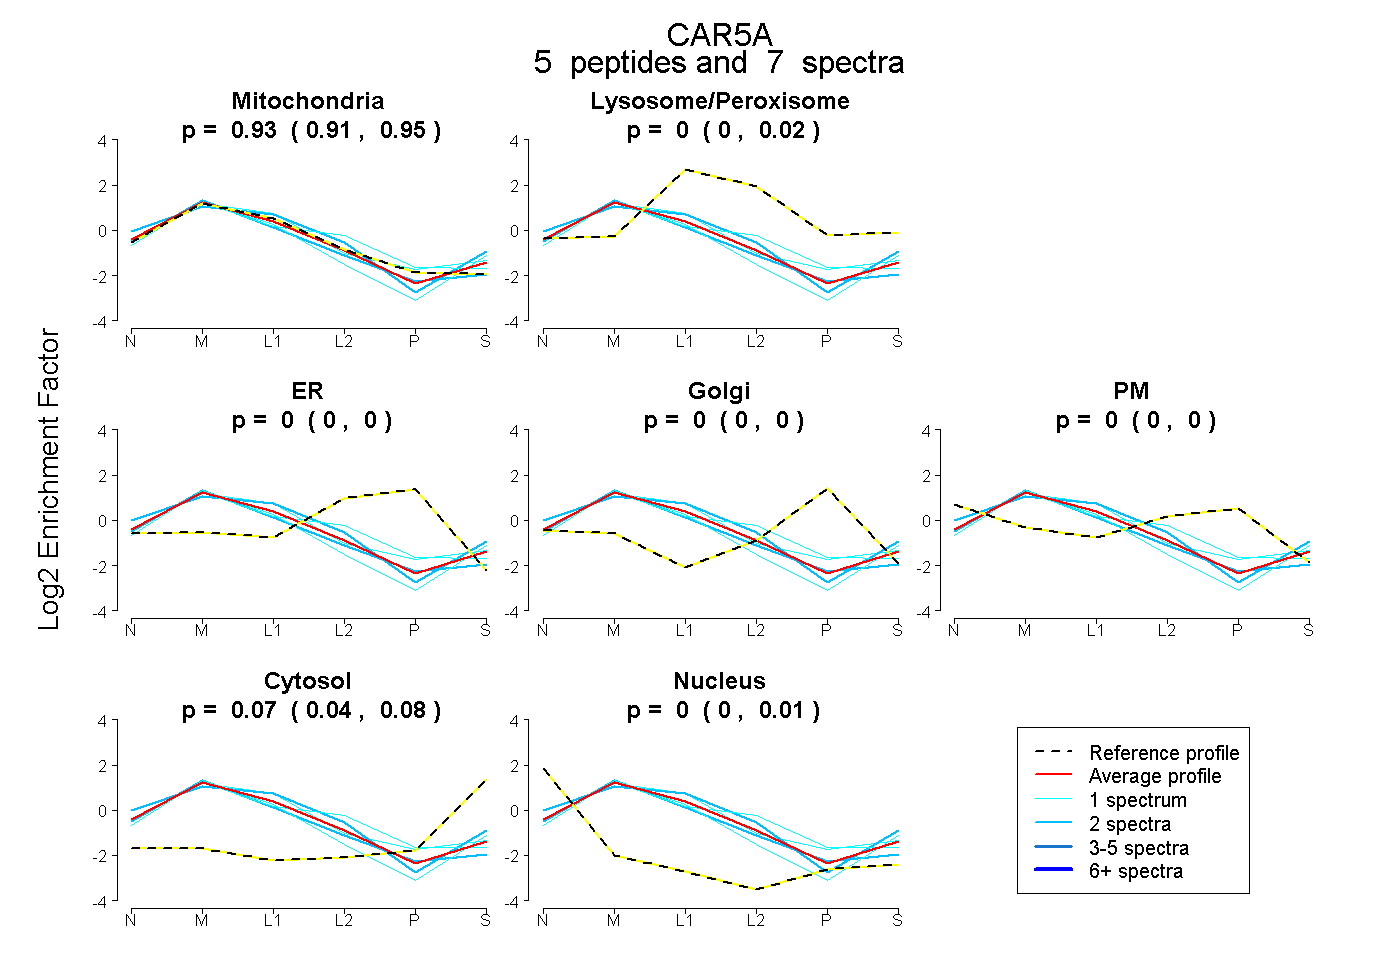
0.909 | 0.948
0.000 | 0.016
0.000 | 0.000
0.000 | 0.000
0.000 | 0.000
0.044 | 0.082
0.000 | 0.010