 3
3peptides
spectra
0.000 | 0.000
0.000 | 0.000
0.000 | 0.000
0.000 | 0.000
0.721 | 0.751
0.000 | 0.000
0.246 | 0.276
0.000 | 0.000
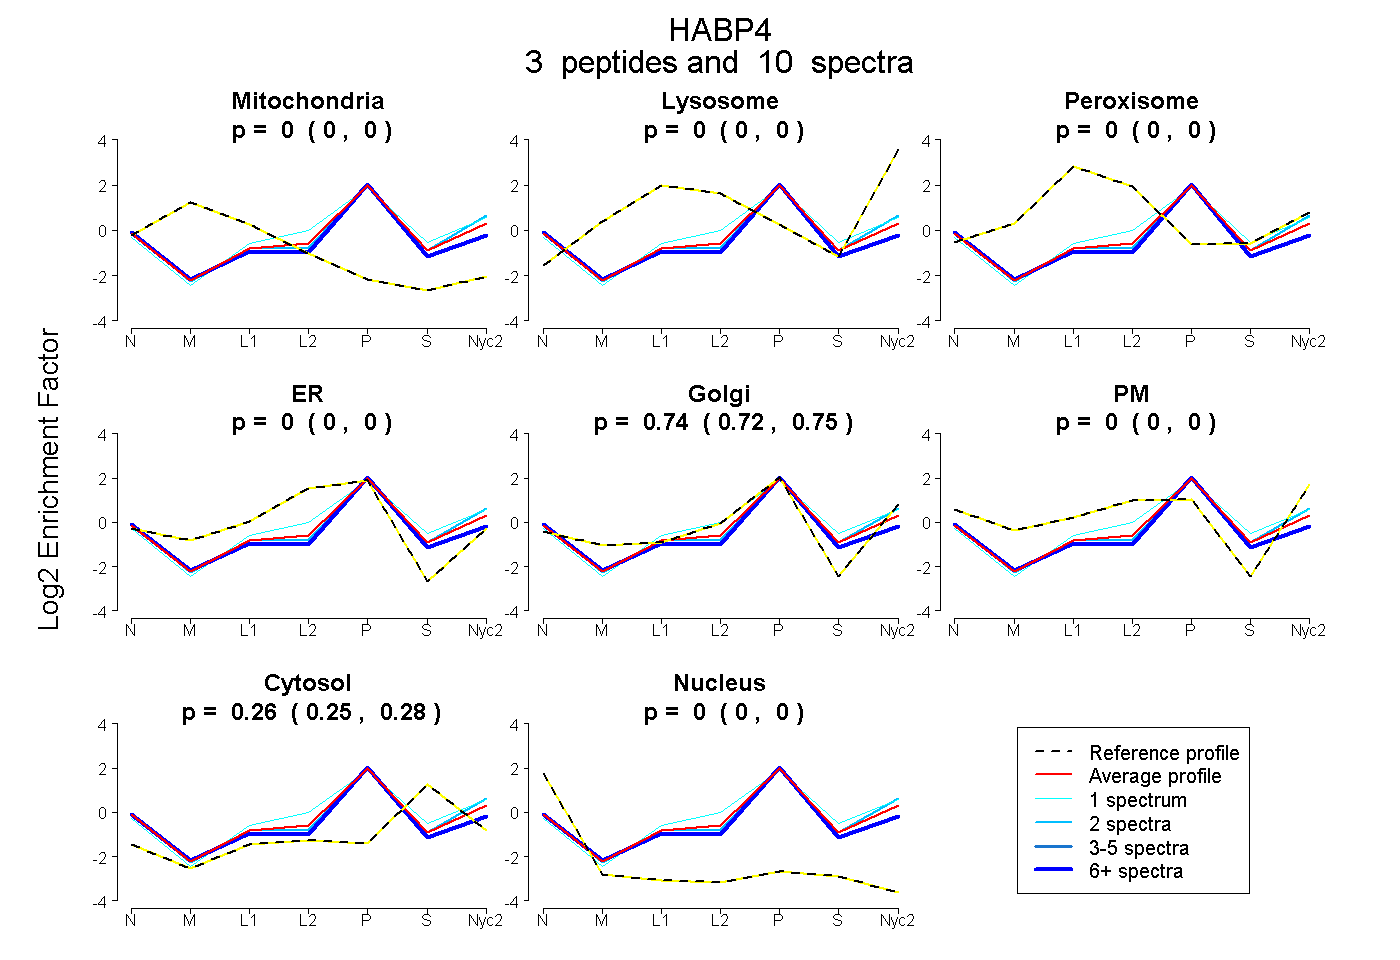
| Plot | Mito | Lyso | Perox | ER | Golgi | PM | Cytosol | Nucleus | |||||
| Expt A |
3 peptides |
10 spectra |
|
0.000 0.000 | 0.000 |
0.000 0.000 | 0.000 |
0.000 0.000 | 0.000 |
0.000 0.000 | 0.000 |
0.737 0.721 | 0.751 |
0.000 0.000 | 0.000 |
0.263 0.246 | 0.276 |
0.000 0.000 | 0.000 |
| 2 spectra, FTDEKPVDR | 0.000 | 0.000 | 0.000 | 0.000 | 0.743 | 0.000 | 0.257 | 0.000 | ||
| 7 spectra, QQQLQR | 0.000 | 0.000 | 0.000 | 0.000 | 0.716 | 0.000 | 0.228 | 0.056 | ||
| 1 spectrum, KPESTVPSK | 0.000 | 0.004 | 0.000 | 0.074 | 0.628 | 0.000 | 0.294 | 0.000 |
| Plot | Lyso | Other | |||||||||||
| Expt C |
2 peptides |
4 spectra |
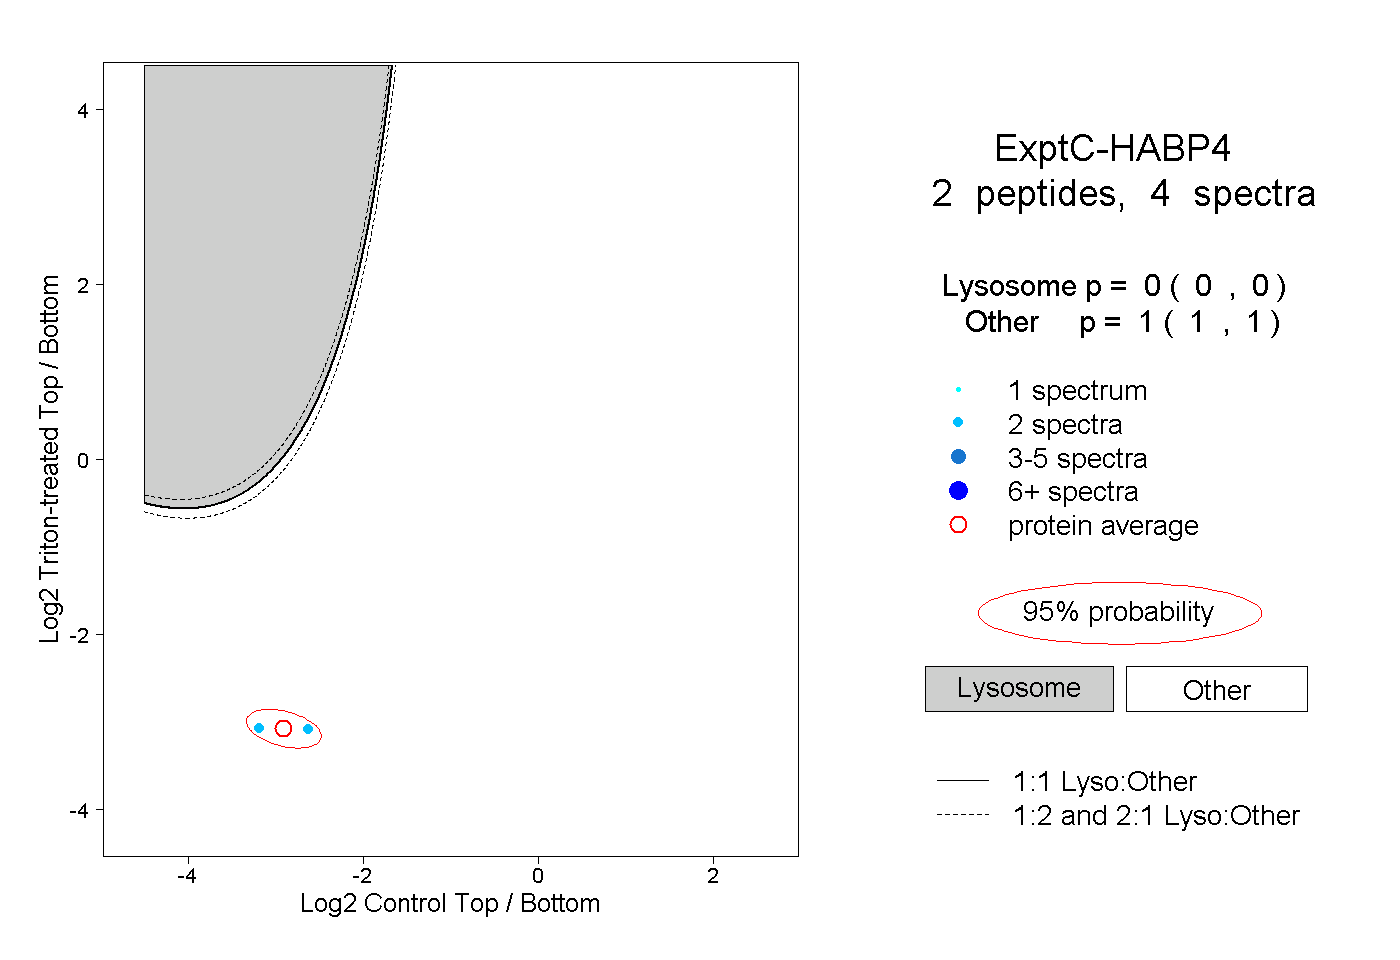 |
0.000 0.000 | 0.000 |
1.000 1.000 | 1.000 |