 4
4peptides
spectra
0.000 | 0.000
0.050 | 0.090
0.056 | 0.106
0.090 | 0.148
0.000 | 0.013
0.515 | 0.576
0.160 | 0.185
0.000 | 0.000
| Plot | Mito | Lyso | Perox | ER | Golgi | PM | Cytosol | Nucleus | |||||
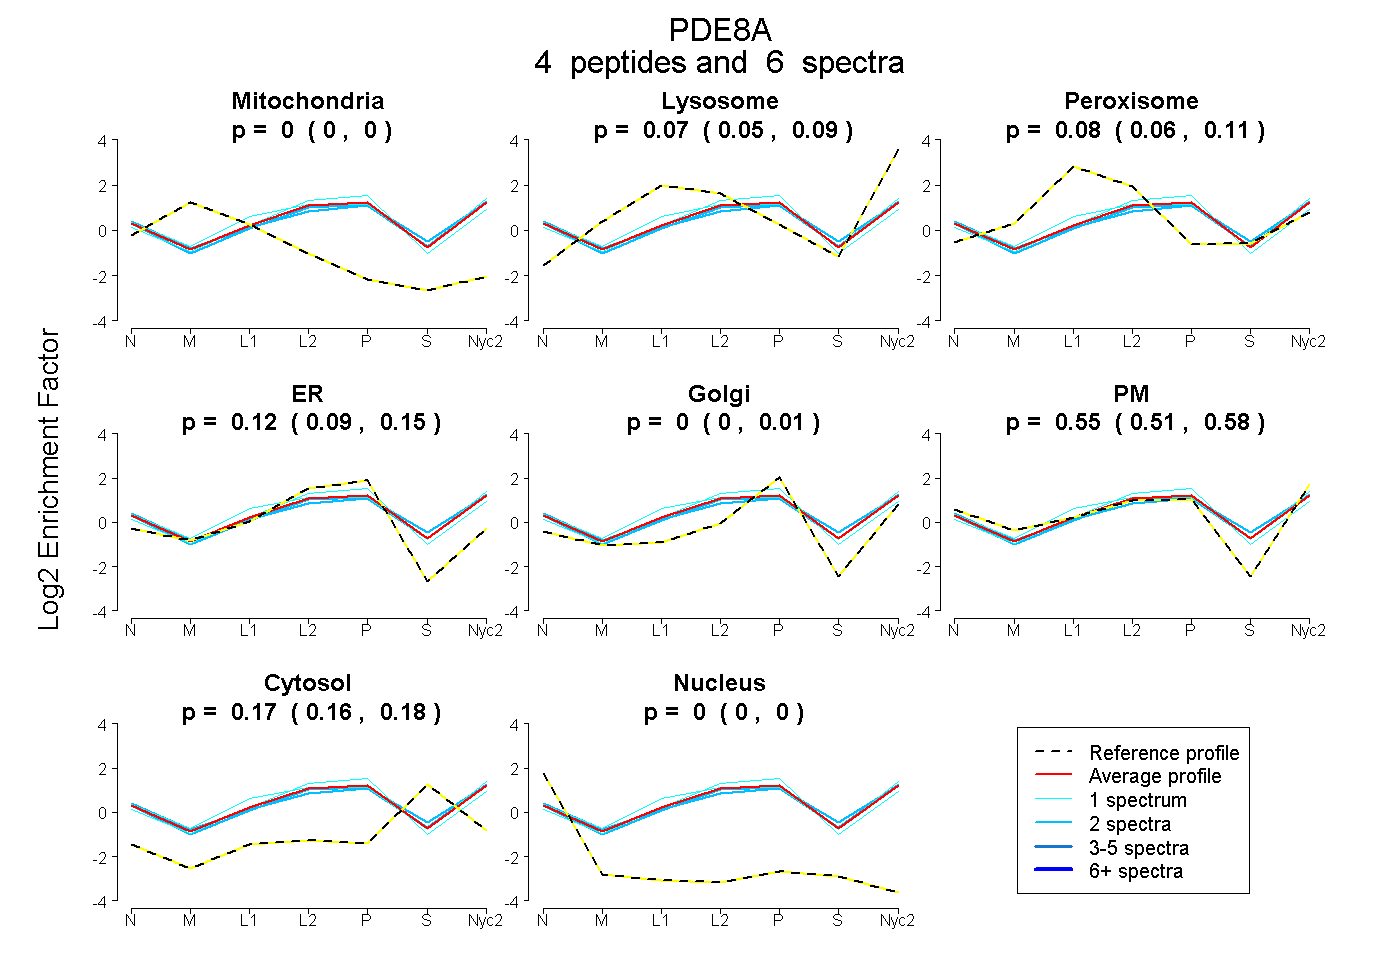
| Expt A |
4 peptides |
6 spectra |
|
0.000 0.000 | 0.000 |
0.071 0.050 | 0.090 |
0.083 0.056 | 0.106 |
0.122 0.090 | 0.148 |
0.000 0.000 | 0.013 |
0.550 0.515 | 0.576 |
0.174 0.160 | 0.185 |
0.000 0.000 | 0.000 |
| 2 spectra, HLEDNFK | 0.000 | 0.020 | 0.103 | 0.000 | 0.029 | 0.655 | 0.192 | 0.000 | ||
| 1 spectrum, LSENTVIVGVVR | 0.000 | 0.067 | 0.180 | 0.030 | 0.026 | 0.574 | 0.123 | 0.000 | ||
| 1 spectrum, VETTTECVQTDSQTDSQAGK | 0.000 | 0.098 | 0.043 | 0.364 | 0.000 | 0.360 | 0.135 | 0.000 | ||
| 2 spectra, HFEHVNK | 0.000 | 0.076 | 0.067 | 0.078 | 0.000 | 0.555 | 0.223 | 0.000 |
| Plot | Lyso | Other | |||||||||||
| Expt C |
5 peptides |
12 spectra |
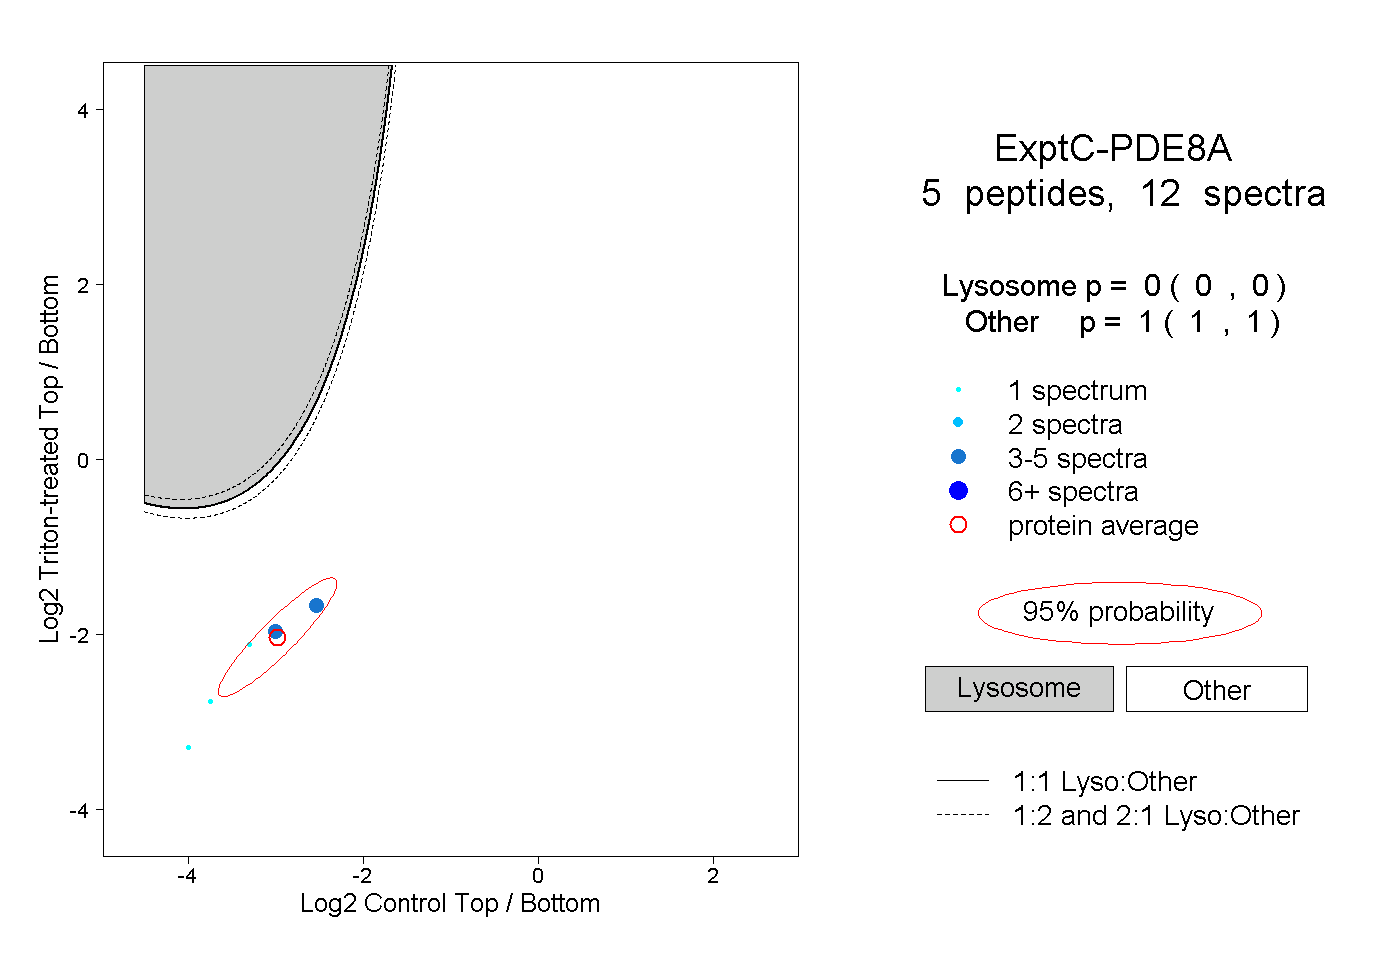 |
0.000 0.000 | 0.000 |
1.000 1.000 | 1.000 |