 8
8peptides
spectra
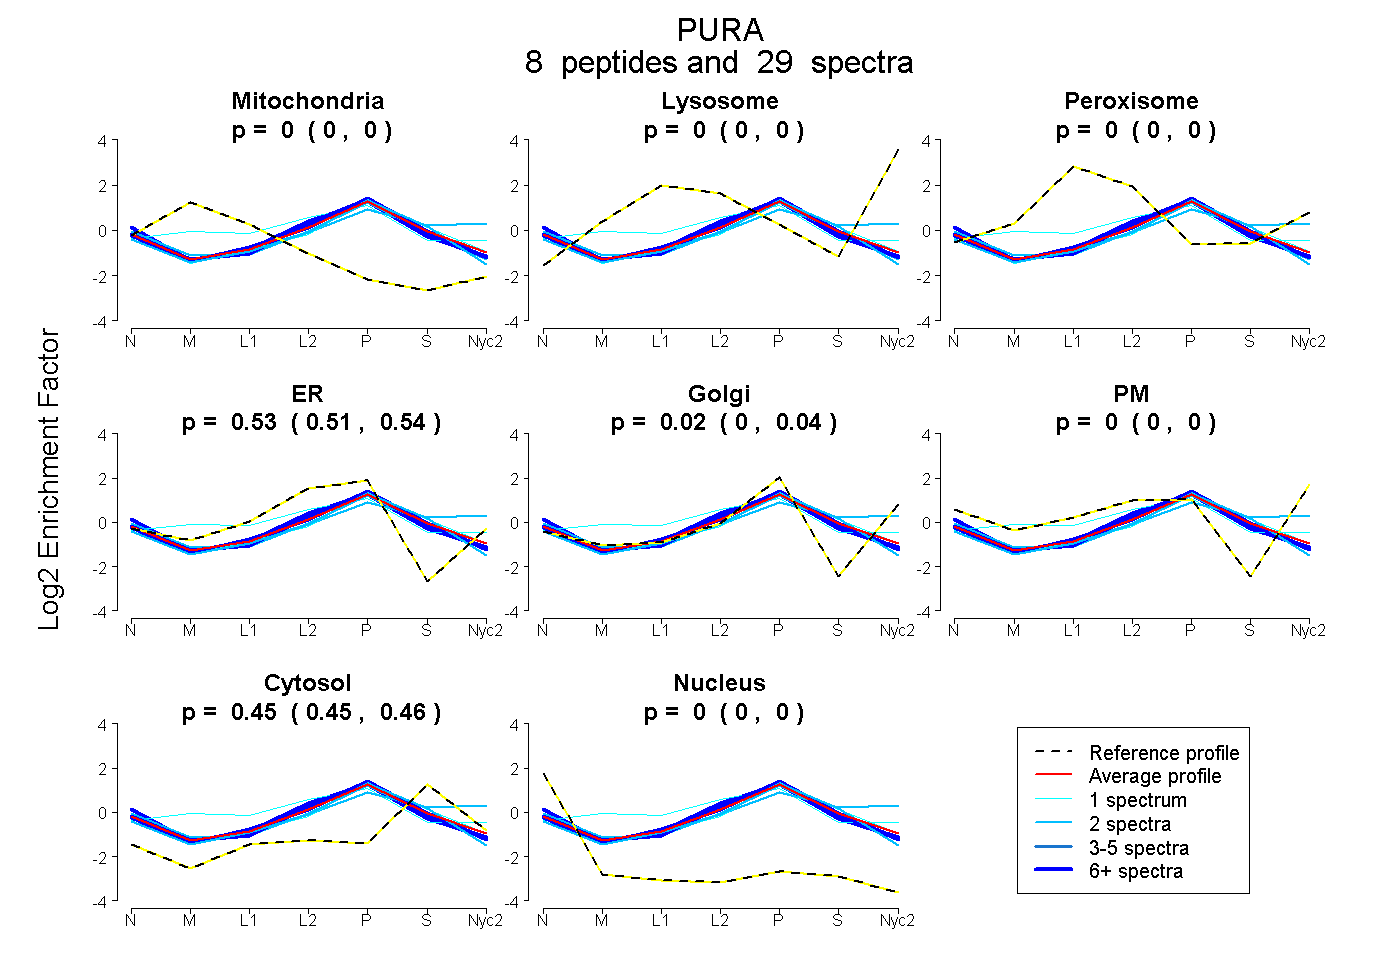
0.000 | 0.000
0.000 | 0.000
0.000 | 0.000
0.509 | 0.544
0.000 | 0.037
0.000 | 0.000
0.447 | 0.458
0.000 | 0.000
3peptides
spectra
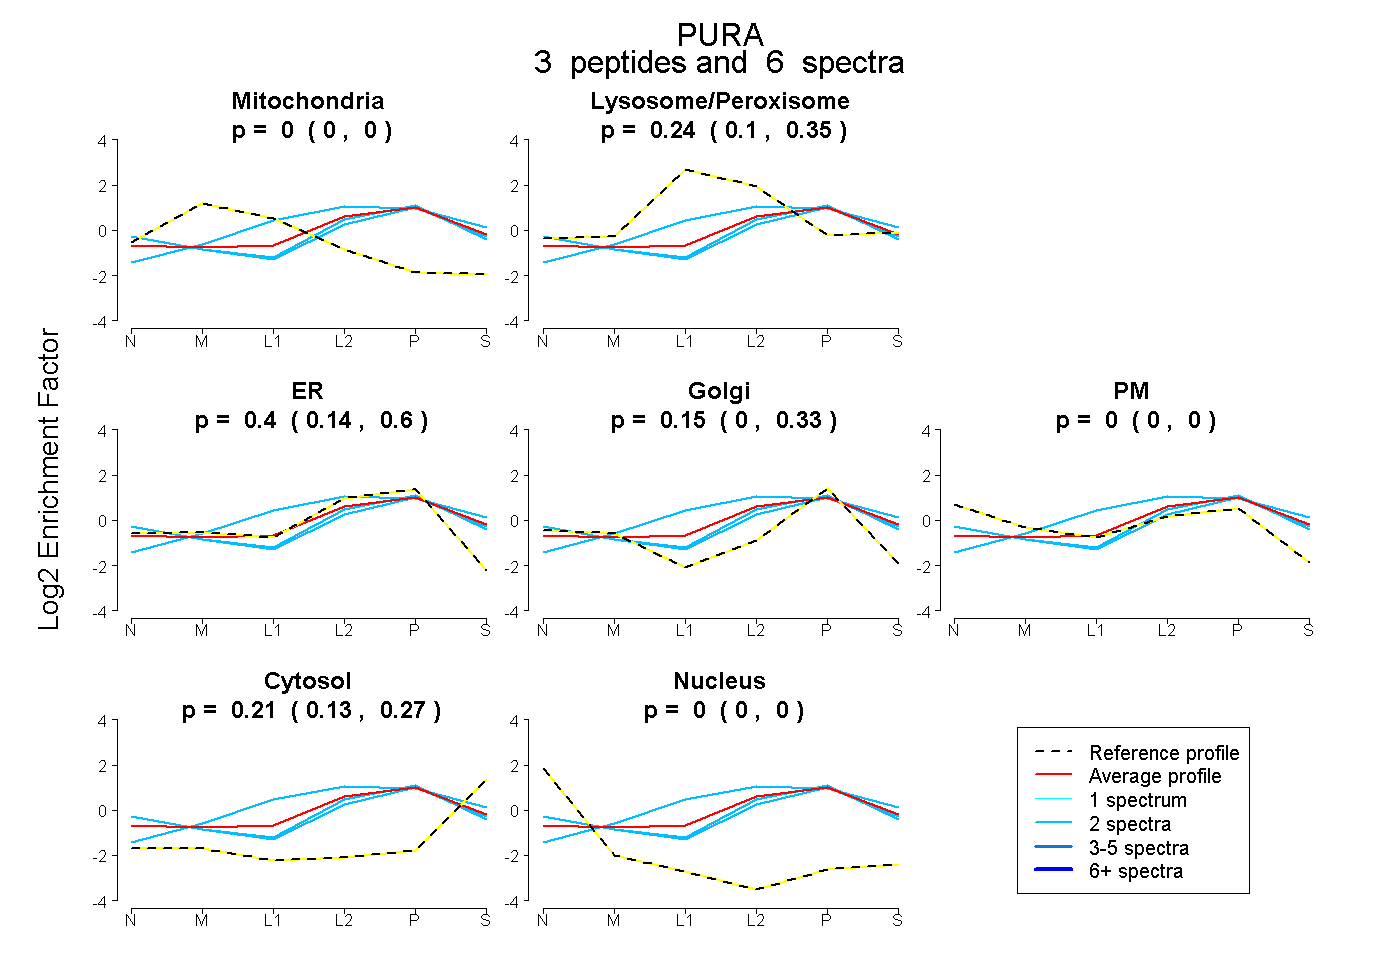
0.000 | 0.000
0.100 | 0.350
0.144 | 0.599
0.000 | 0.334
0.000 | 0.000
0.129 | 0.265
0.000 | 0.000
7peptides
spectra
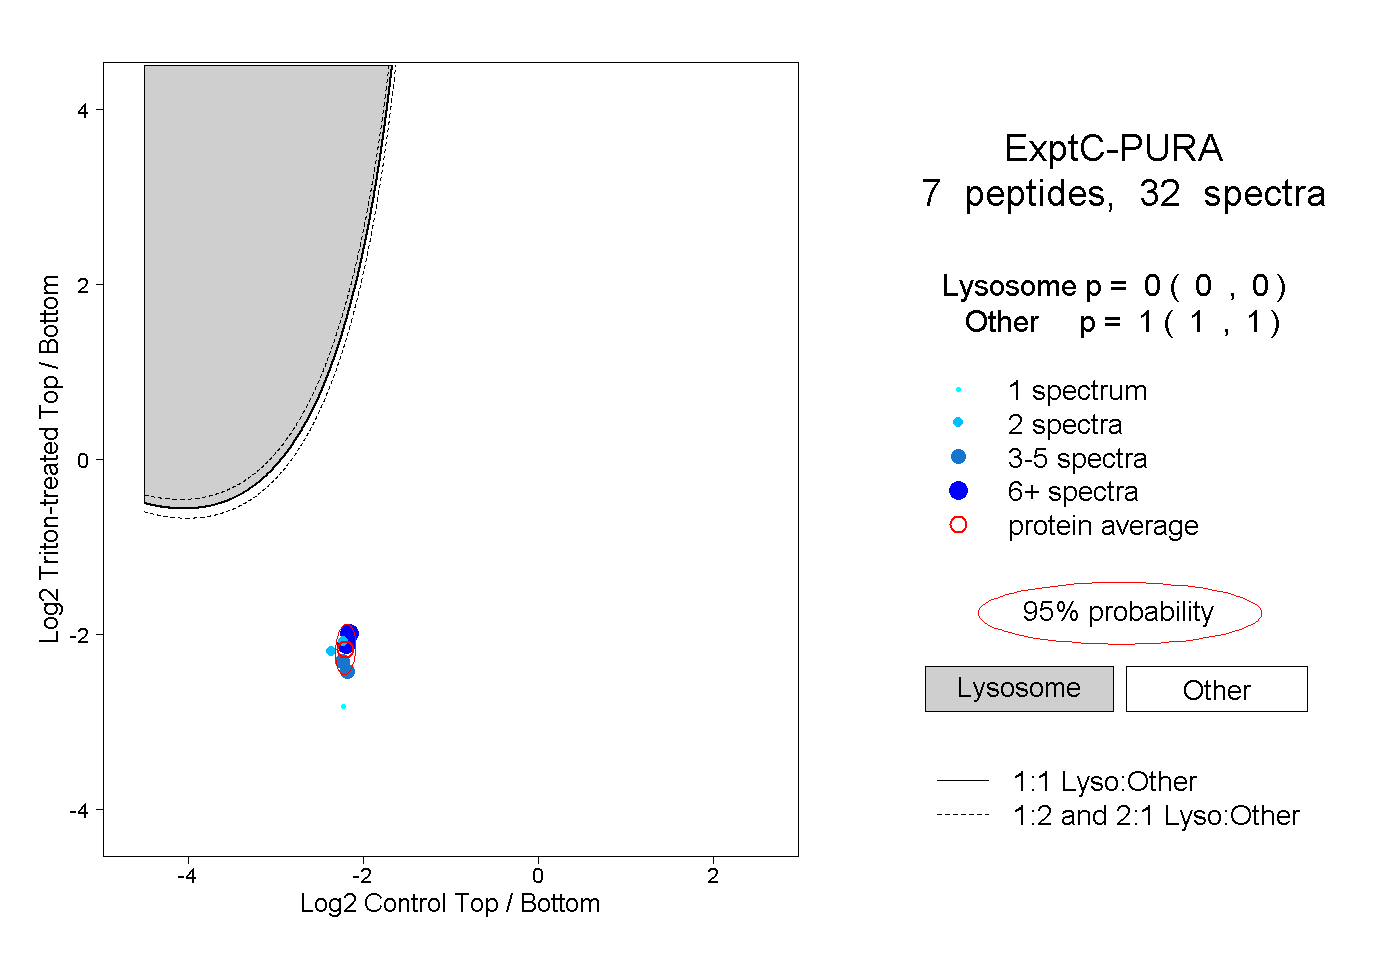
0.000 | 0.000
1.000 | 1.000
4peptides
spectra
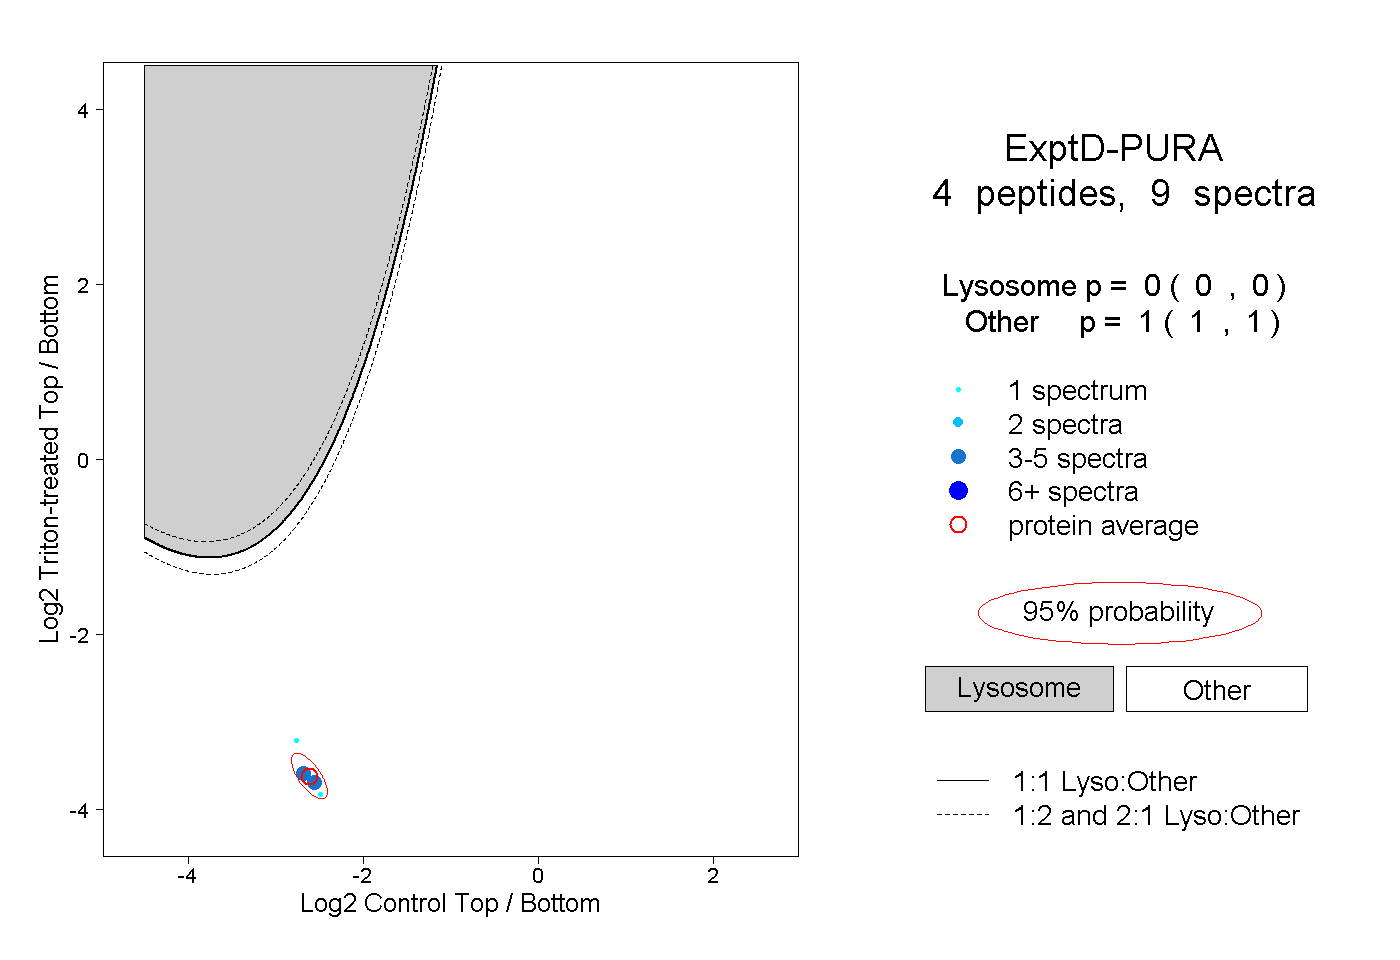
0.000 | 0.000
1.000 | 1.000