 7
7peptides
spectra
0.000 | 0.000
0.000 | 0.000
0.121 | 0.186
0.000 | 0.095
0.061 | 0.199
0.464 | 0.573
0.114 | 0.169
0.000 | 0.000
13peptides
spectra

0.000 | 0.000
1.000 | 1.000
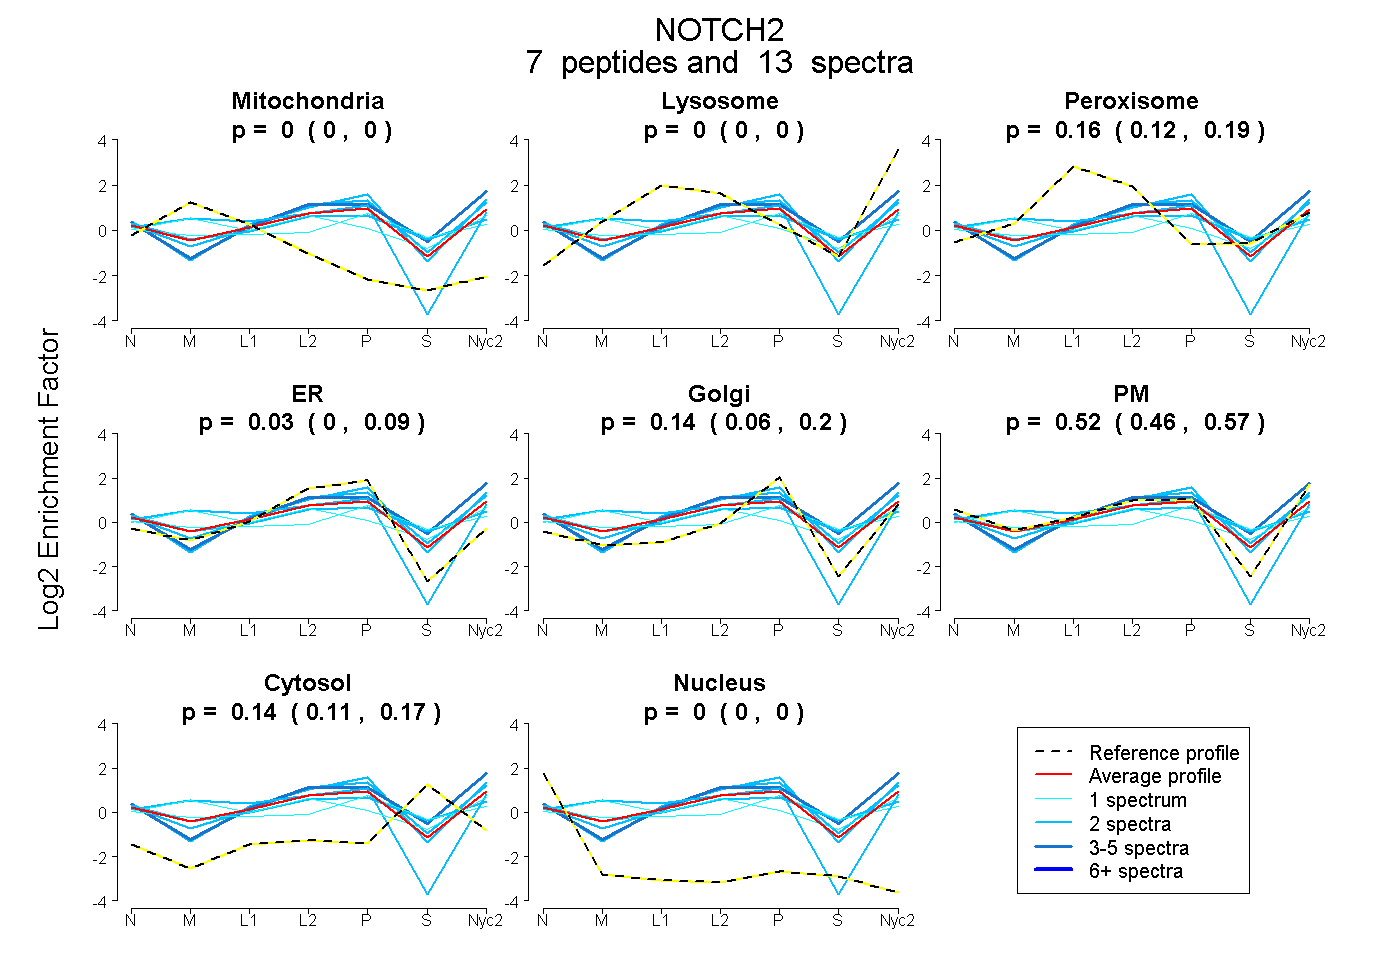
| Plot | Mito | Lyso | Perox | ER | Golgi | PM | Cytosol | Nucleus | |||||
| Expt A |
7 peptides |
13 spectra |
|
0.000 0.000 | 0.000 |
0.000 0.000 | 0.000 |
0.159 0.121 | 0.186 |
0.035 0.000 | 0.095 |
0.142 0.061 | 0.199 |
0.521 0.464 | 0.573 |
0.143 0.114 | 0.169 |
0.000 0.000 | 0.000 |
||
| Plot | Lyso | Other | |||||||||||
| Expt C |
13 peptides |
25 spectra |
|
0.000 0.000 | 0.000 |
1.000 1.000 | 1.000 |