GSTM7
[ENSRNOP00000025689]
Main page
| | | Plot |
Mito |
Lyso |
|
Perox |
ER |
Golgi |
PM |
Cytosol |
Nucleus |
|
| Expt A |
 5
5
peptides |
46
spectra |
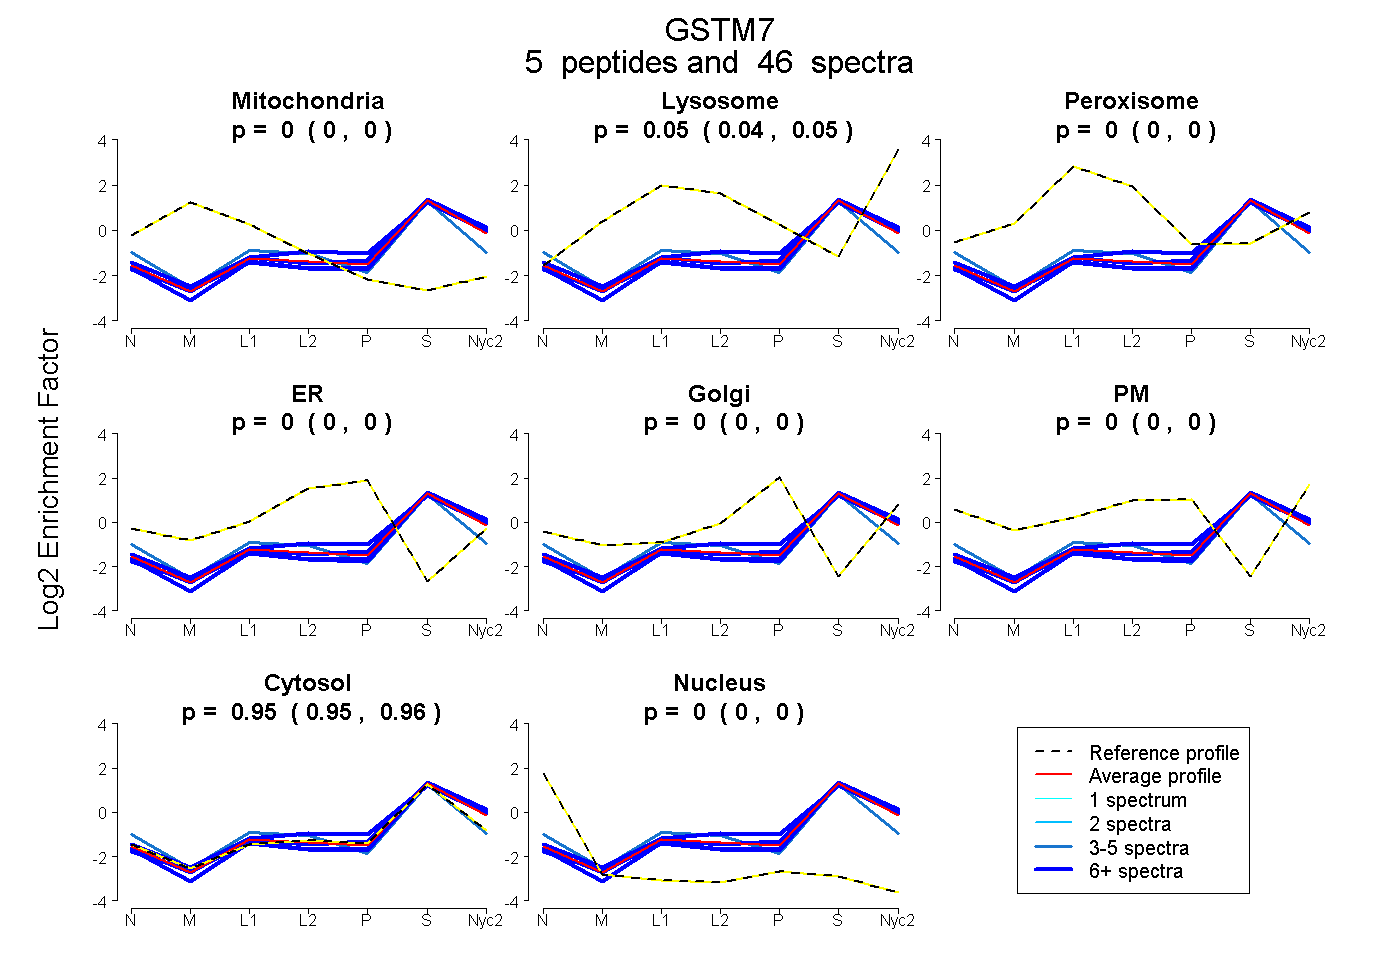 |
0.000
0.000 | 0.000 |
0.046
0.040 | 0.050 |
|
0.000
0.000 | 0.000 |
0.000
0.000 | 0.000 |
0.000
0.000 | 0.000 |
0.000
0.000 | 0.000 |
0.954
0.949 | 0.959 |
0.000
0.000 | 0.000 |
|
| | | Plot |
Mito |
|
Lyso or Perox |
|
ER |
Golgi |
PM |
Cytosol |
Nucleus |
|
| Expt B |
2
peptides |
3
spectra |
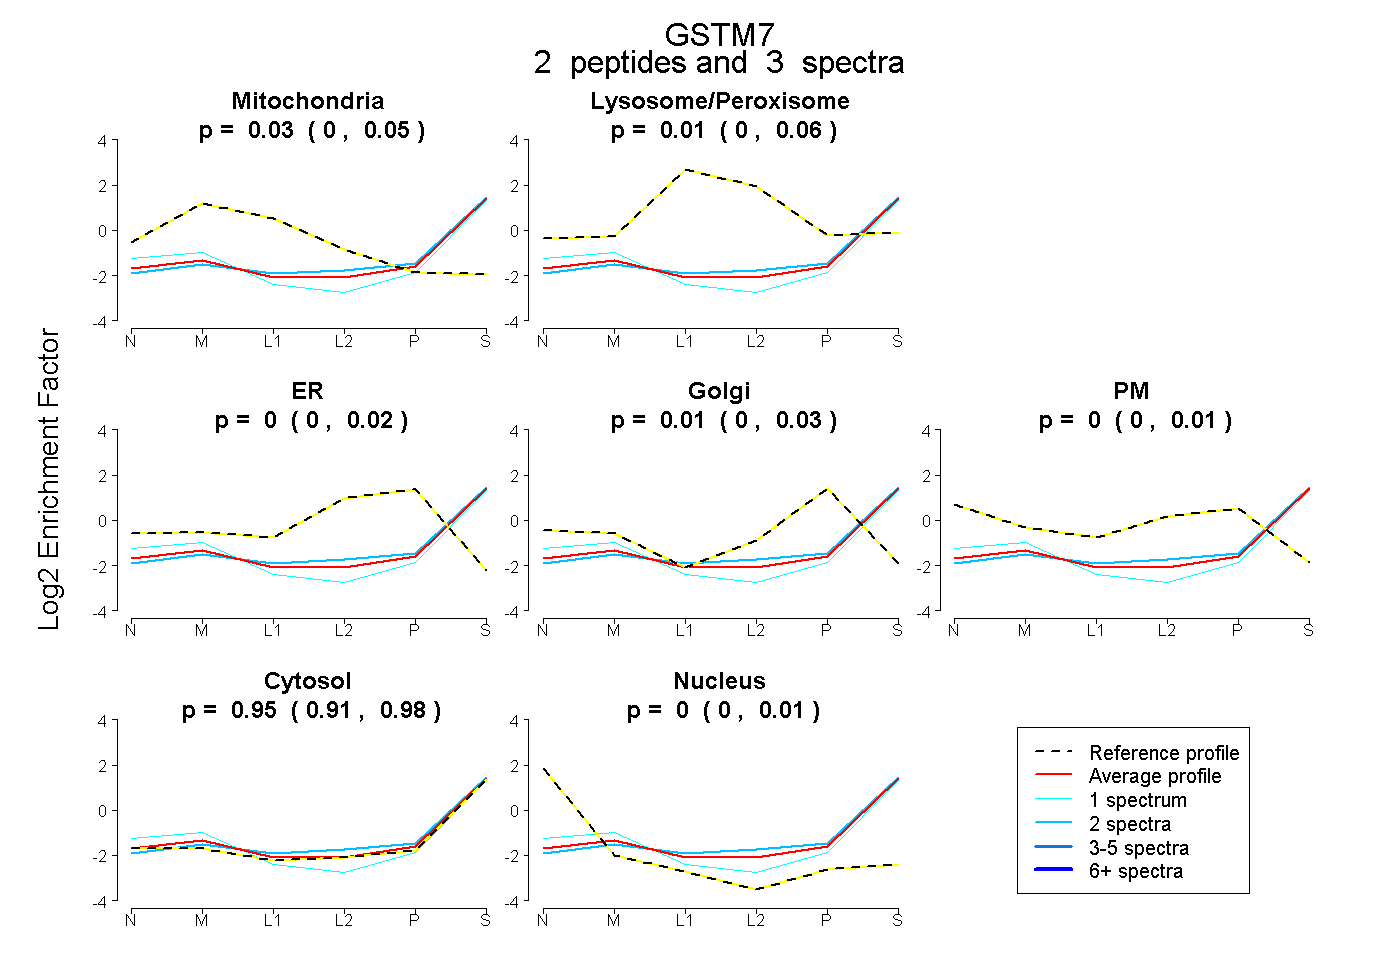 |
0.034
0.000 | 0.055 |
|
0.006
0.000 | 0.065 |
|
0.000
0.000 | 0.021 |
0.006
0.000 | 0.029 |
0.000
0.000 | 0.010 |
0.953
0.908 | 0.981 |
0.000
0.000 | 0.009 |
|
| 1 spectrum, YTMGDAPDFDR |
0.013 |
|
0.000 |
|
0.000 |
0.000 |
0.000 |
0.903 |
0.084 |
|
| 2 spectra, VDILENQLMDNR |
0.000 |
|
0.063 |
|
0.002 |
0.000 |
0.000 |
0.935 |
0.000 |
|
| | | Plot |
|
Lyso |
|
|
|
|
|
|
|
Other |
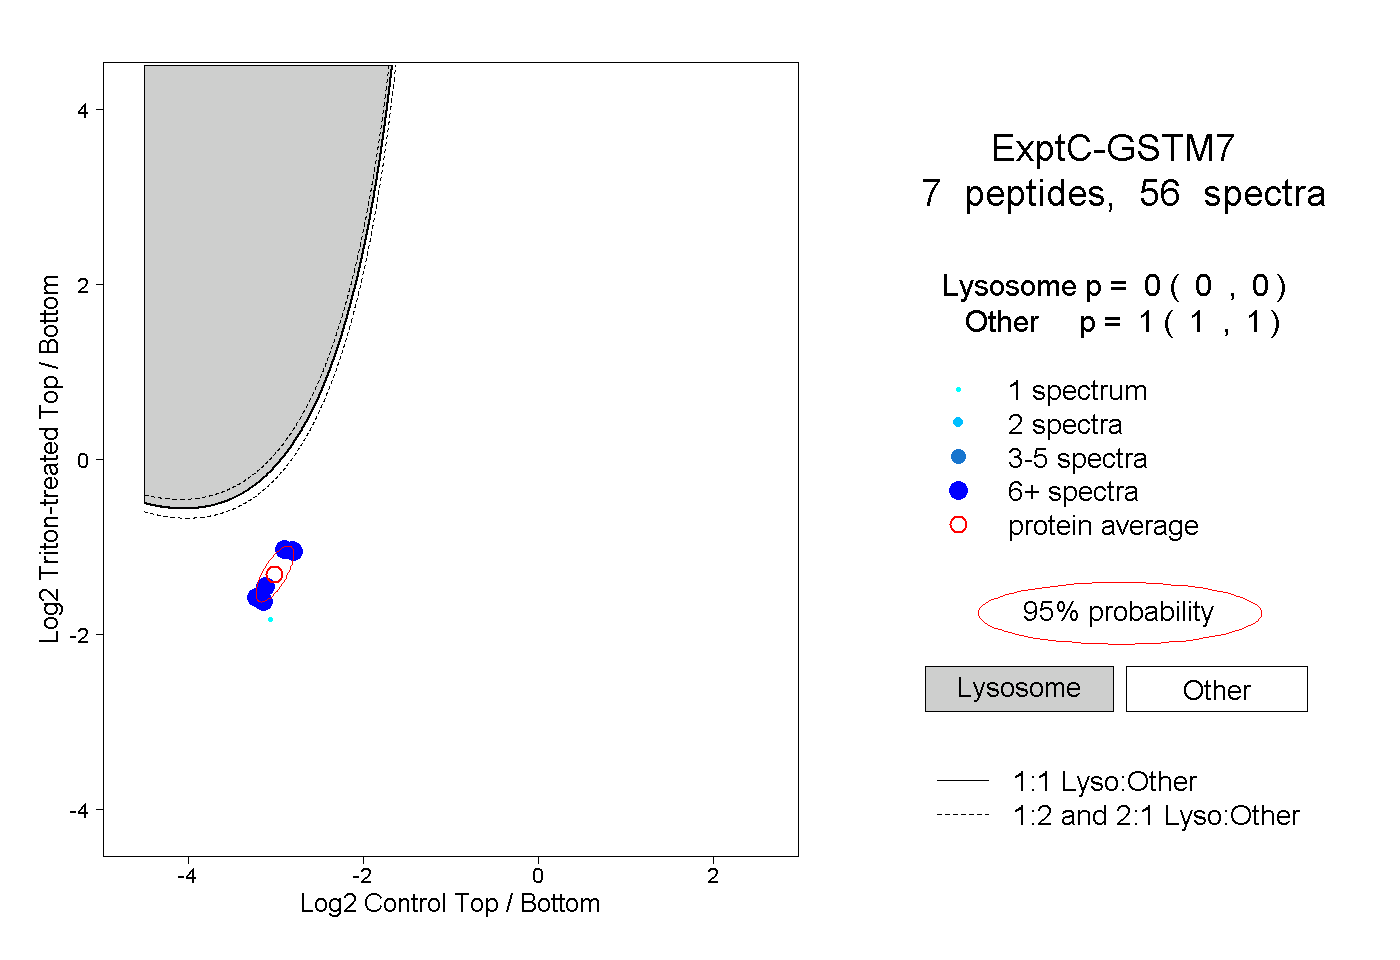
| Expt C |
7
peptides |
56
spectra |
 |
|
0.000
0.000 | 0.000 |
|
|
|
|
|
|
|
1.000
1.000 | 1.000 |