 4
4peptides
spectra
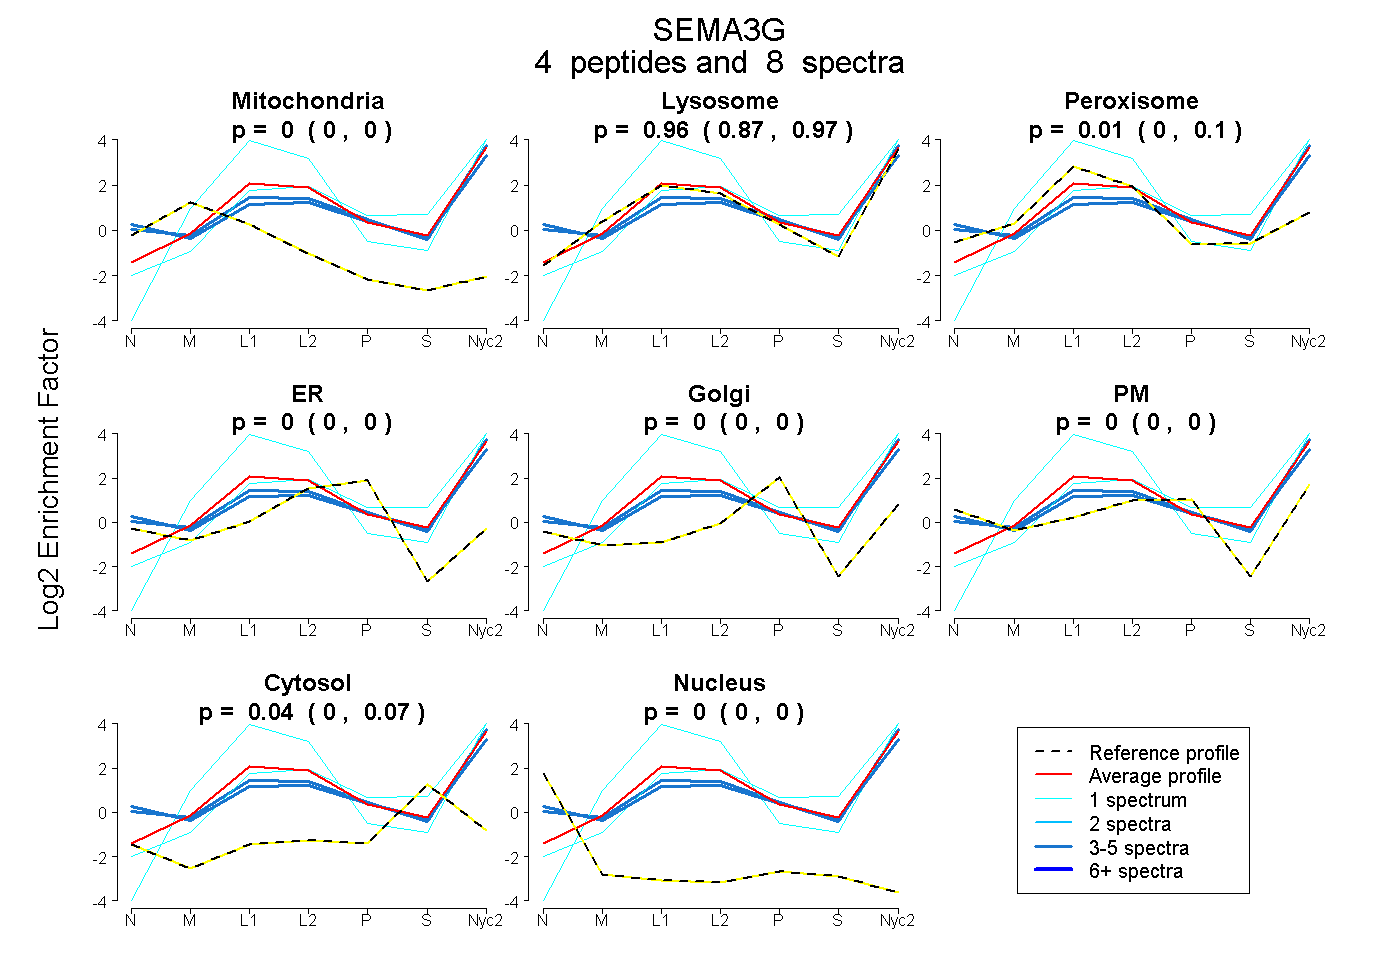
0.000 | 0.000
0.868 | 0.975
0.000 | 0.103
0.000 | 0.000
0.000 | 0.000
0.000 | 0.000
0.000 | 0.069
0.000 | 0.000
9peptides
spectra
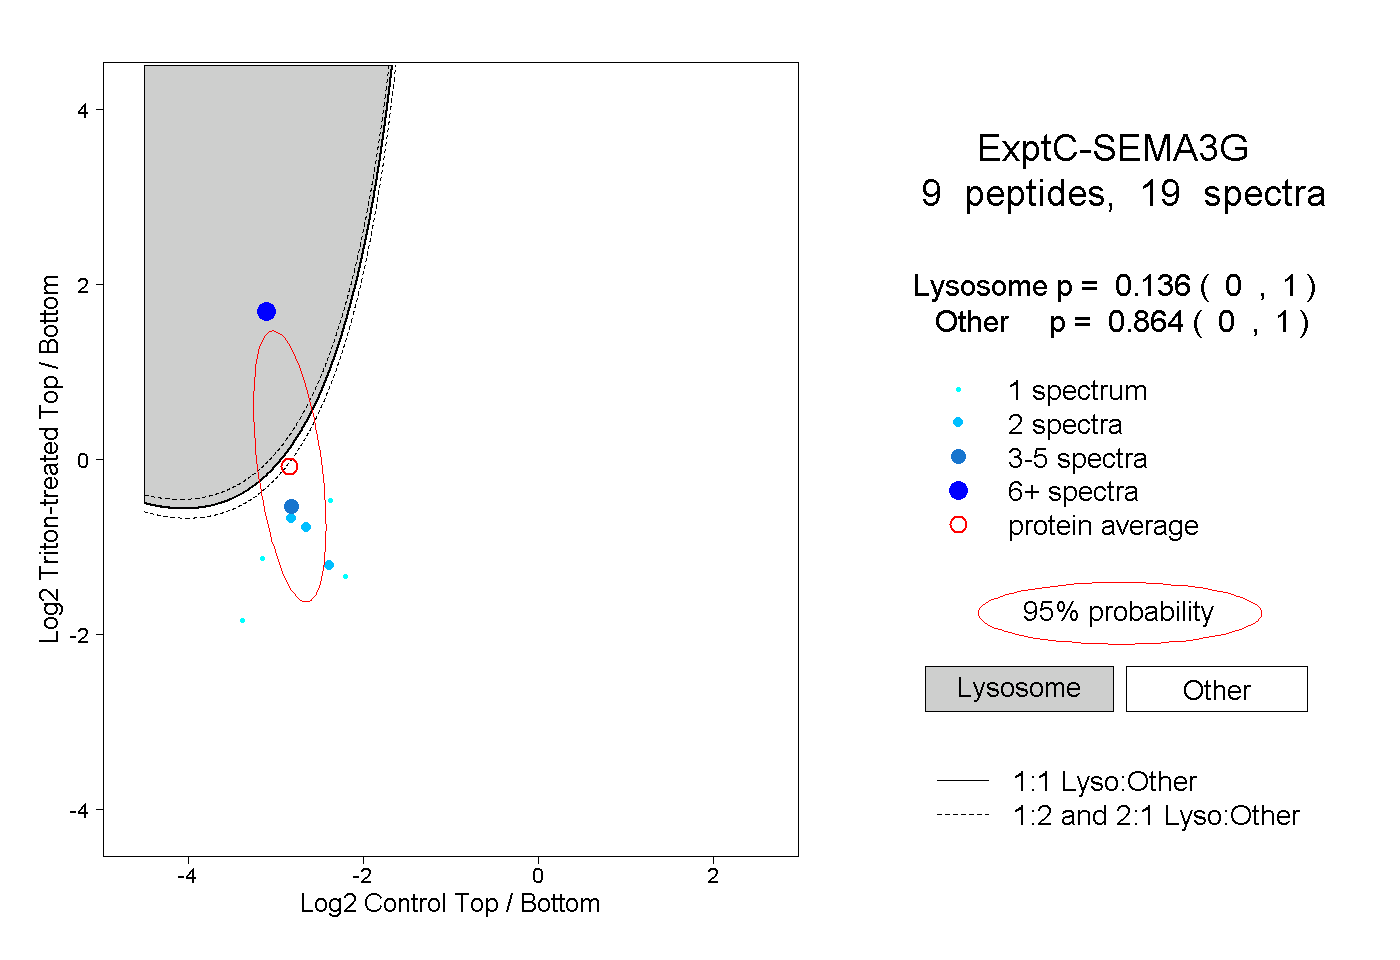
0.000 | 1.000
0.000 | 1.000
1peptide
spectrum
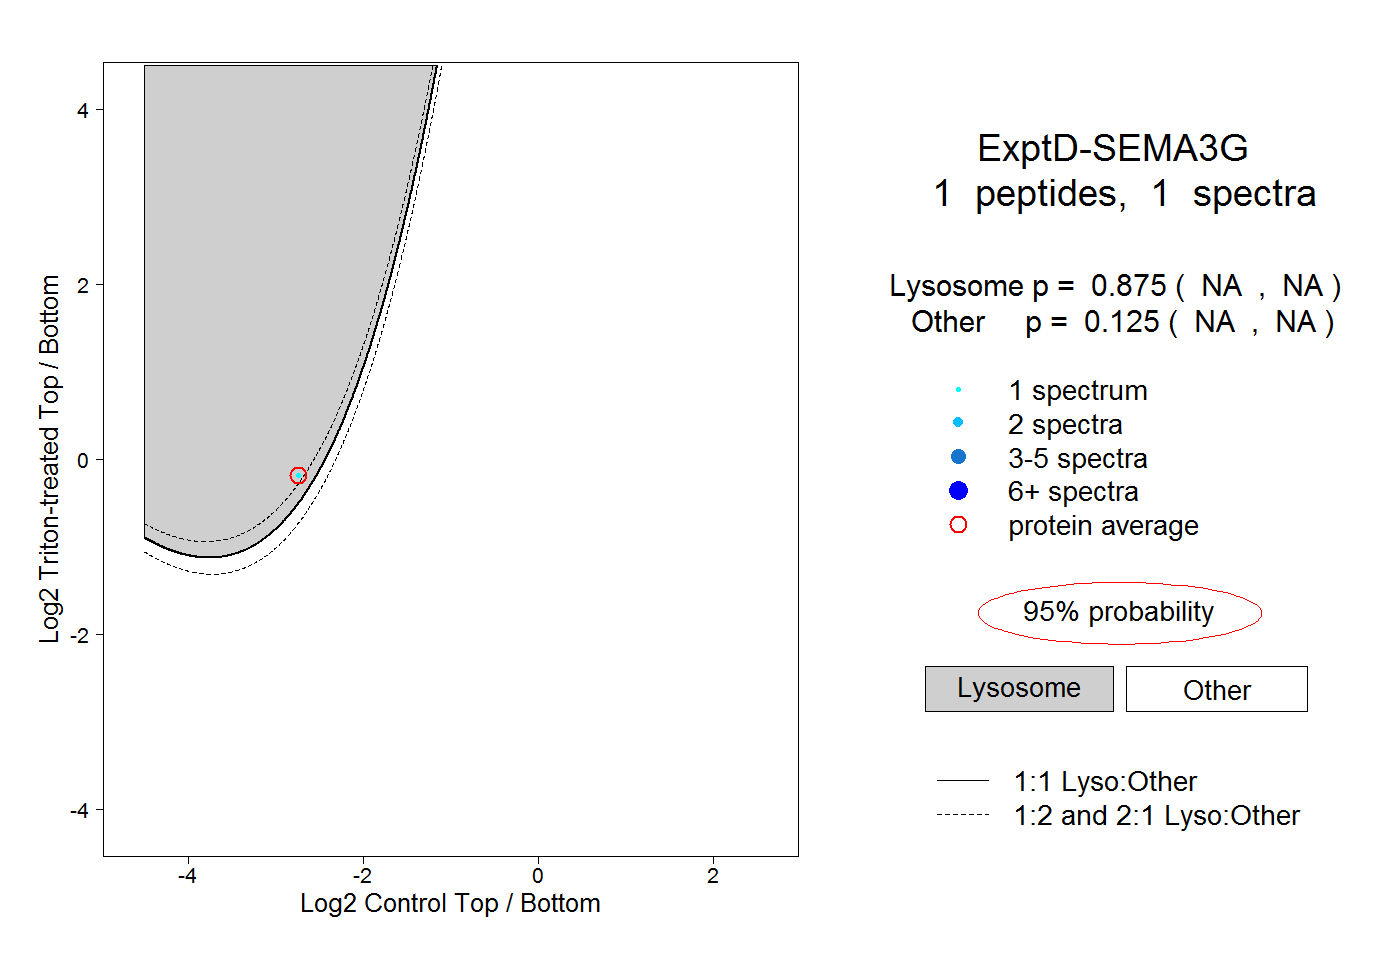
NA | NA
NA | NA