 21
21peptides
spectra
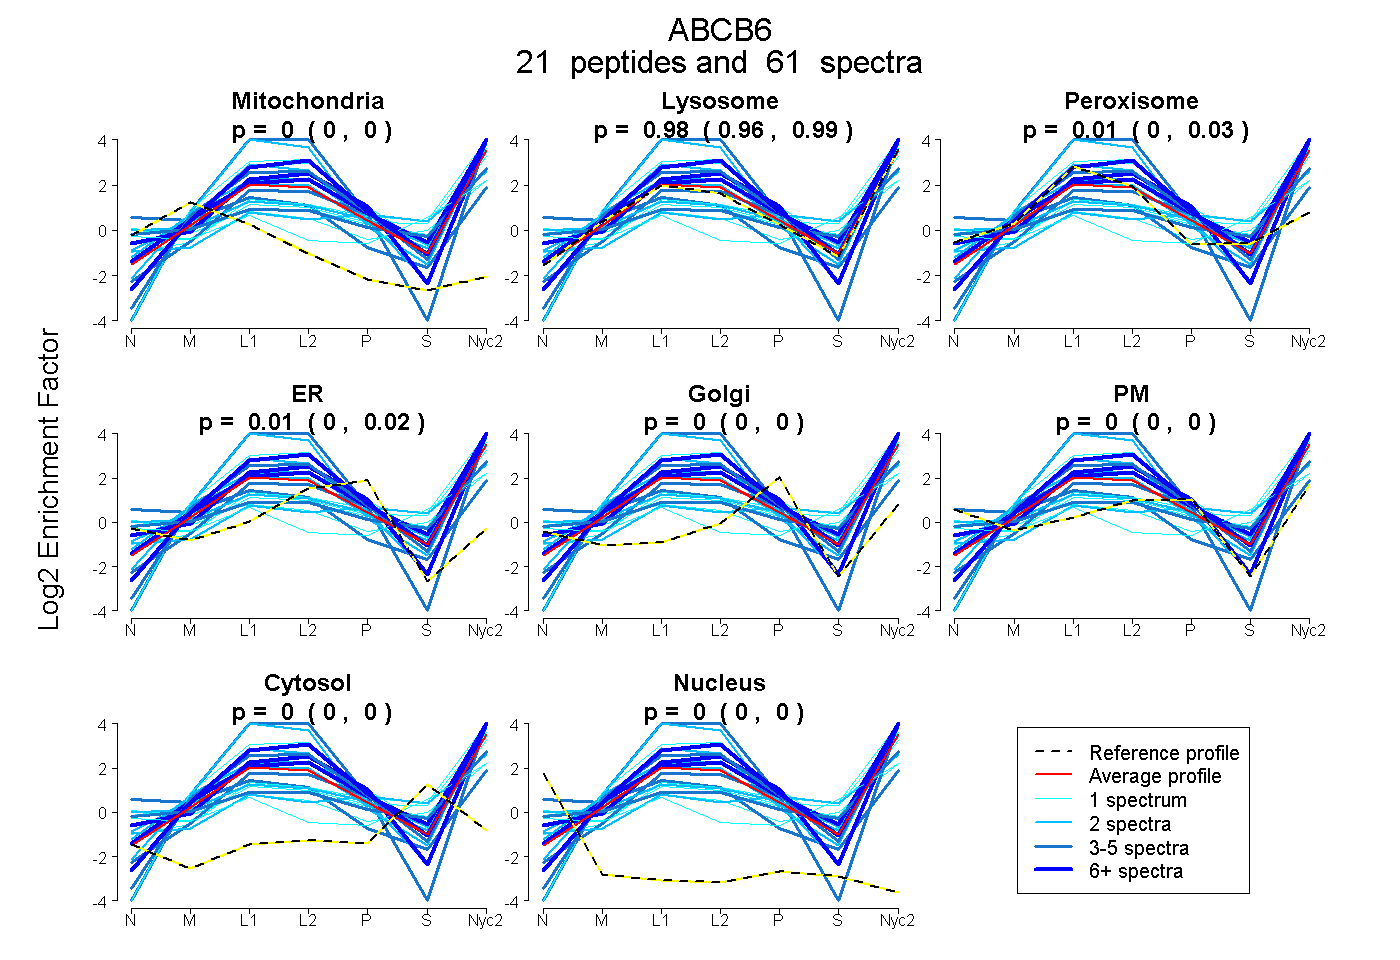
0.000 | 0.000
0.962 | 0.987
0.000 | 0.026
0.000 | 0.020
0.000 | 0.000
0.000 | 0.000
0.000 | 0.000
0.000 | 0.000
15peptides
spectra
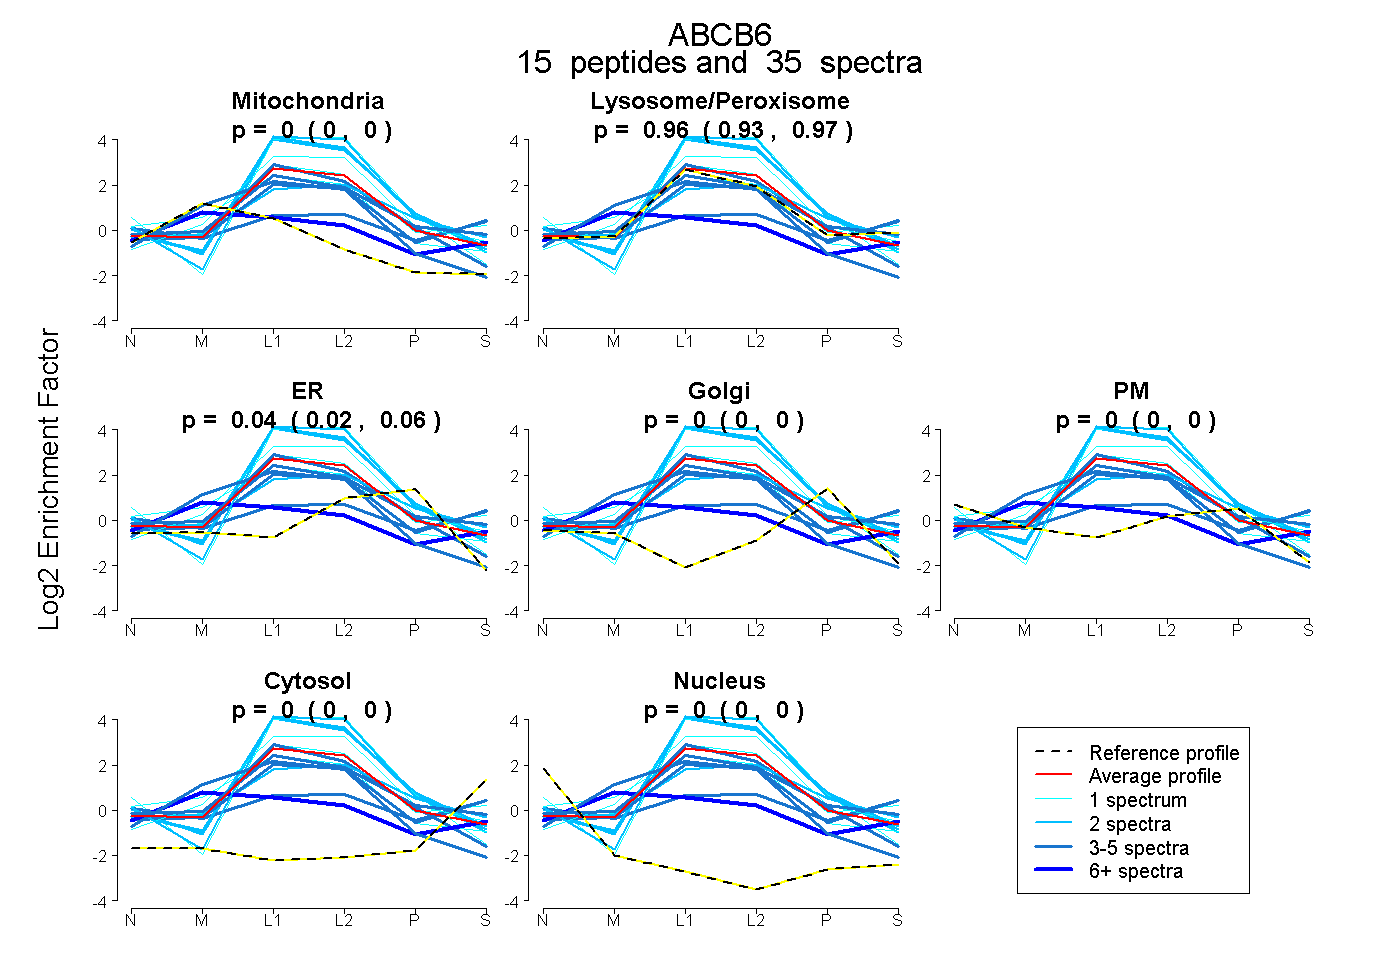
0.000 | 0.000
0.935 | 0.974
0.024 | 0.062
0.000 | 0.000
0.000 | 0.000
0.000 | 0.000
0.000 | 0.000
25peptides
spectra
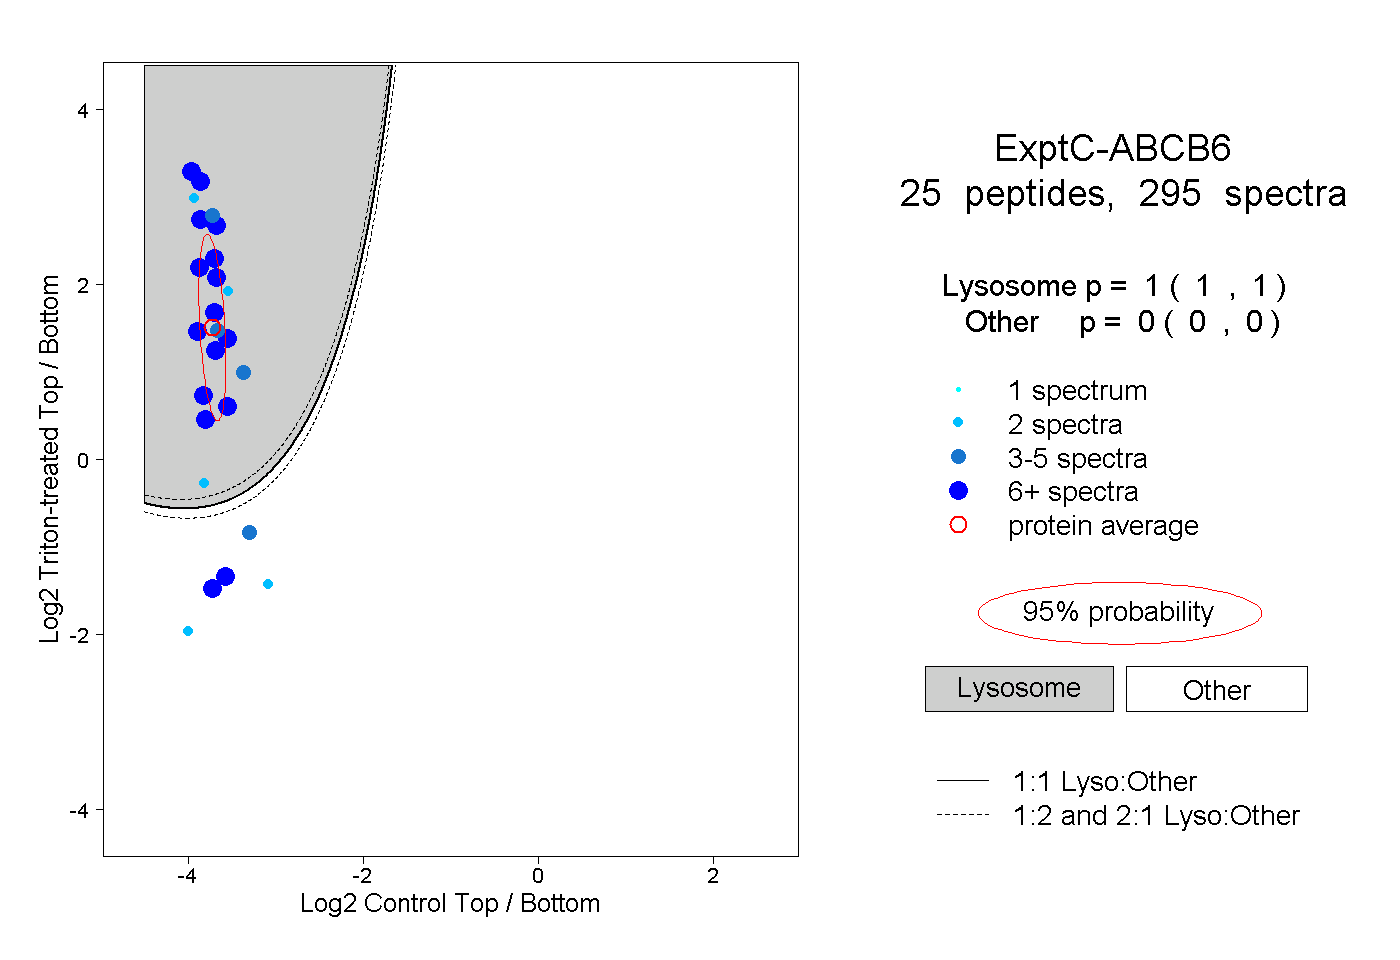
1.000 | 1.000
0.000 | 0.000
14peptides
spectra
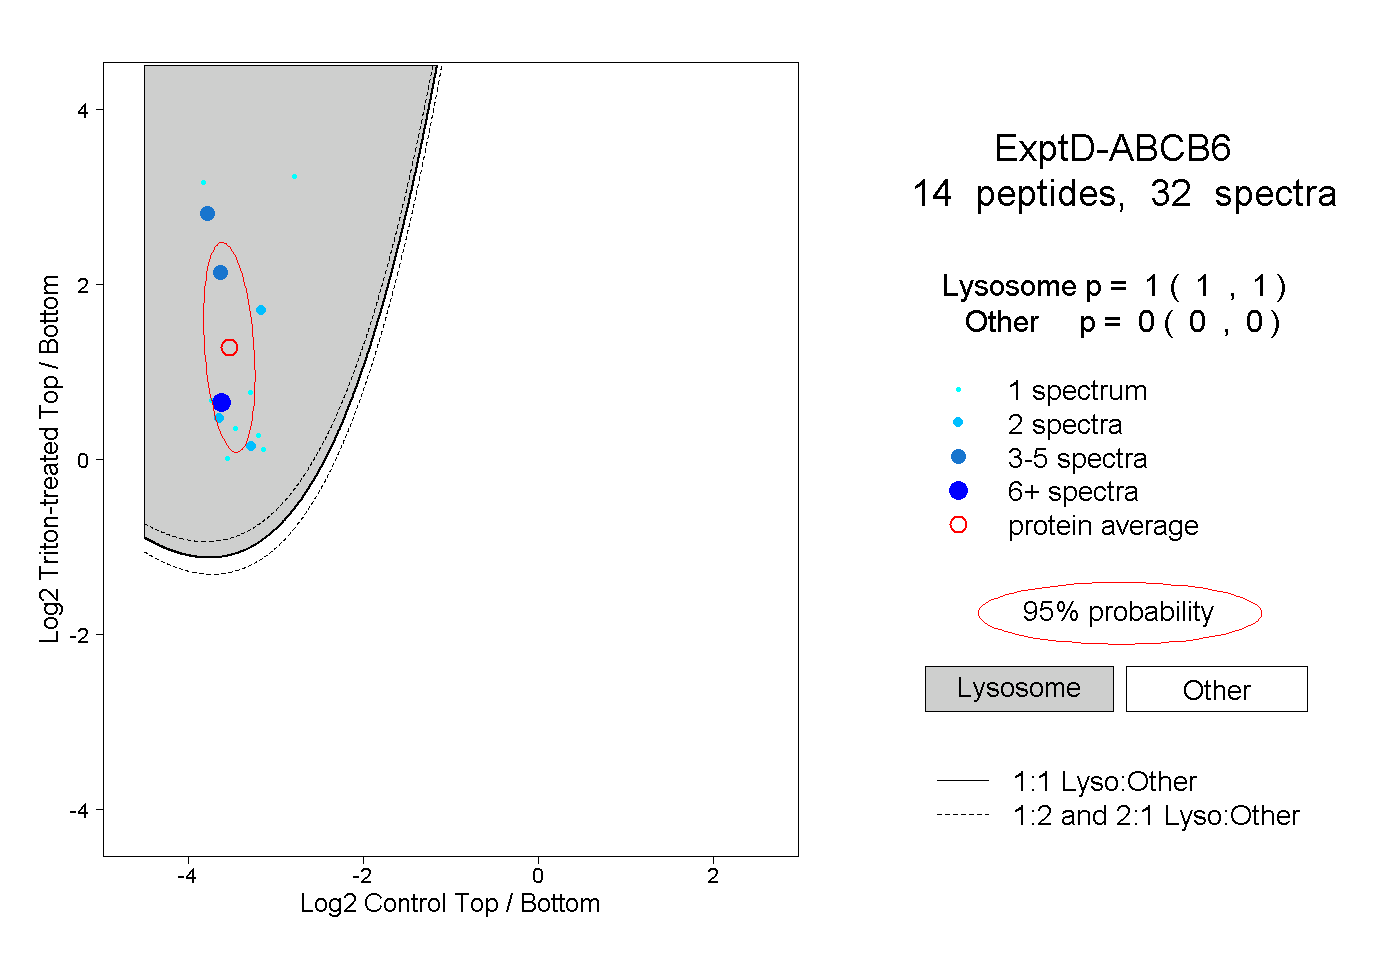
1.000 | 1.000
0.000 | 0.000