 2
2peptides
spectra
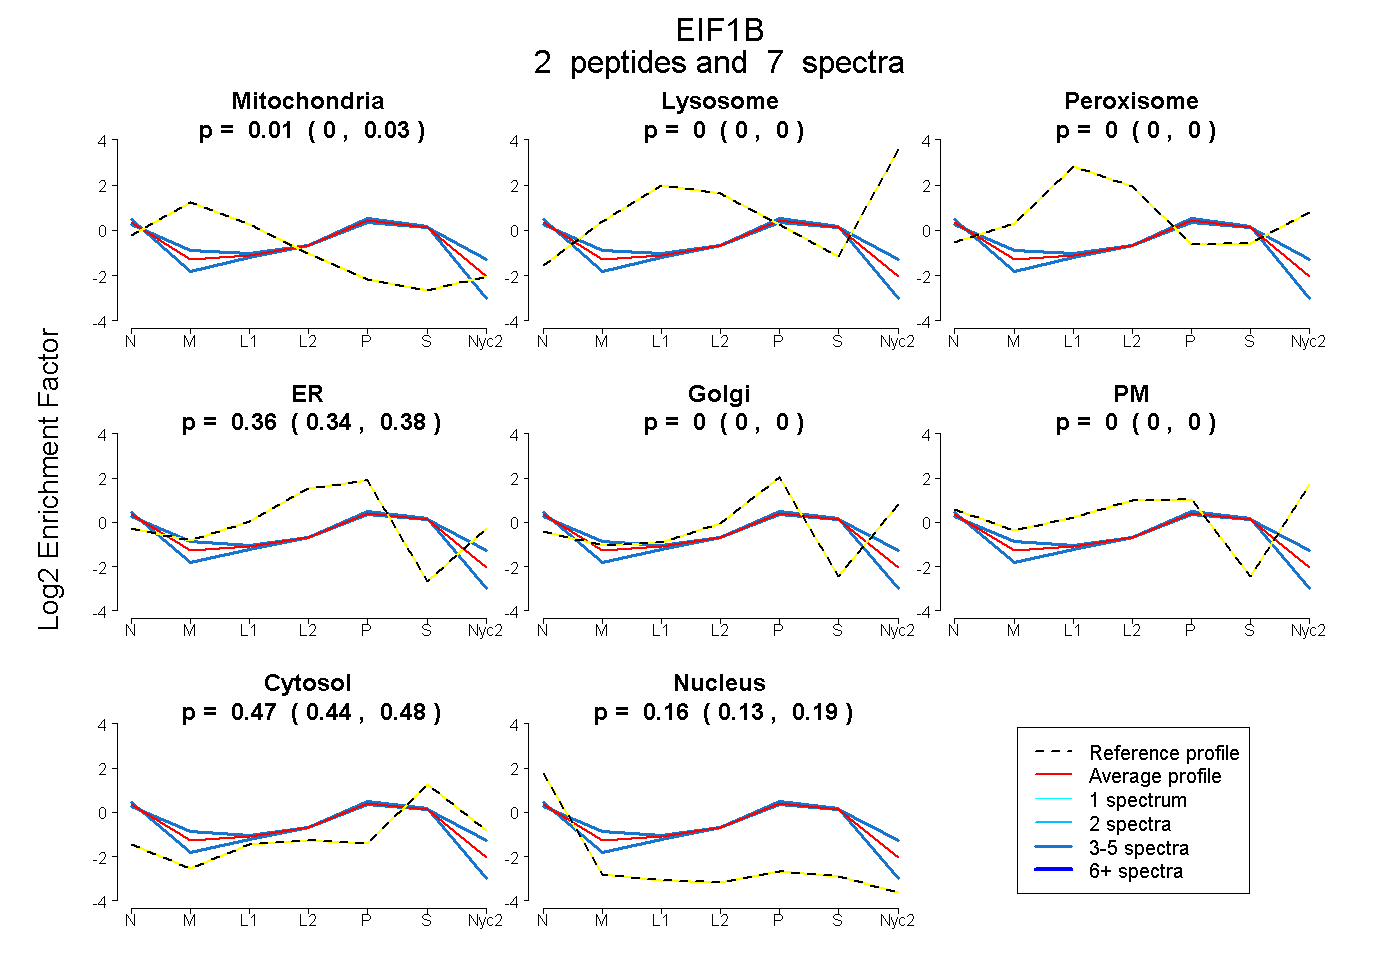
0.000 | 0.035
0.000 | 0.000
0.000 | 0.000
0.343 | 0.380
0.000 | 0.000
0.000 | 0.000
0.441 | 0.483
0.132 | 0.187
1peptide
spectrum
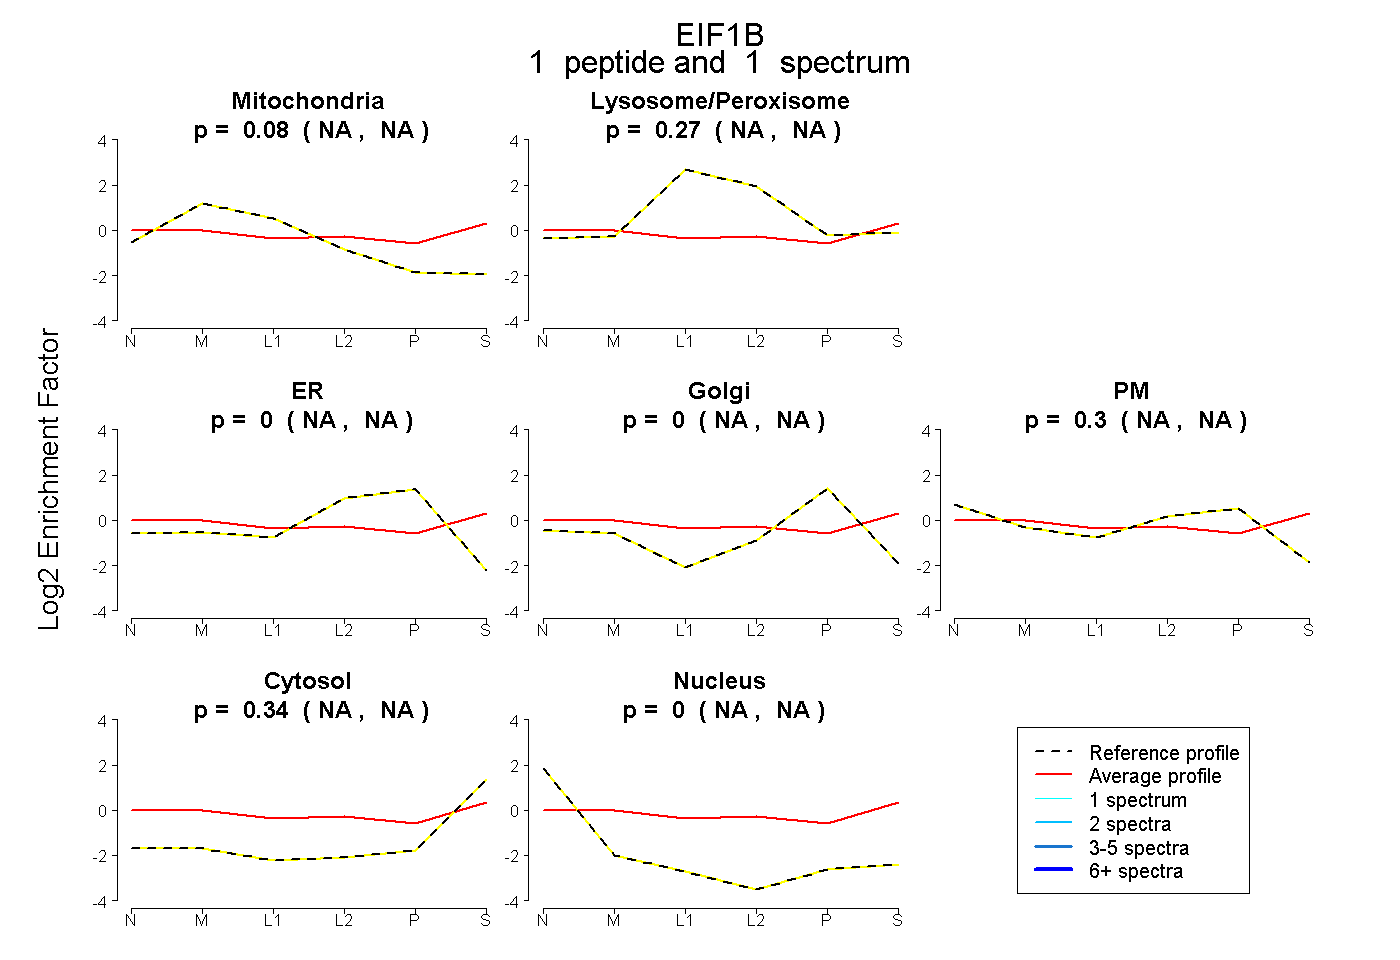
NA | NA
NA | NA
NA | NA
NA | NA
NA | NA
NA | NA
NA | NA
1peptide
spectra
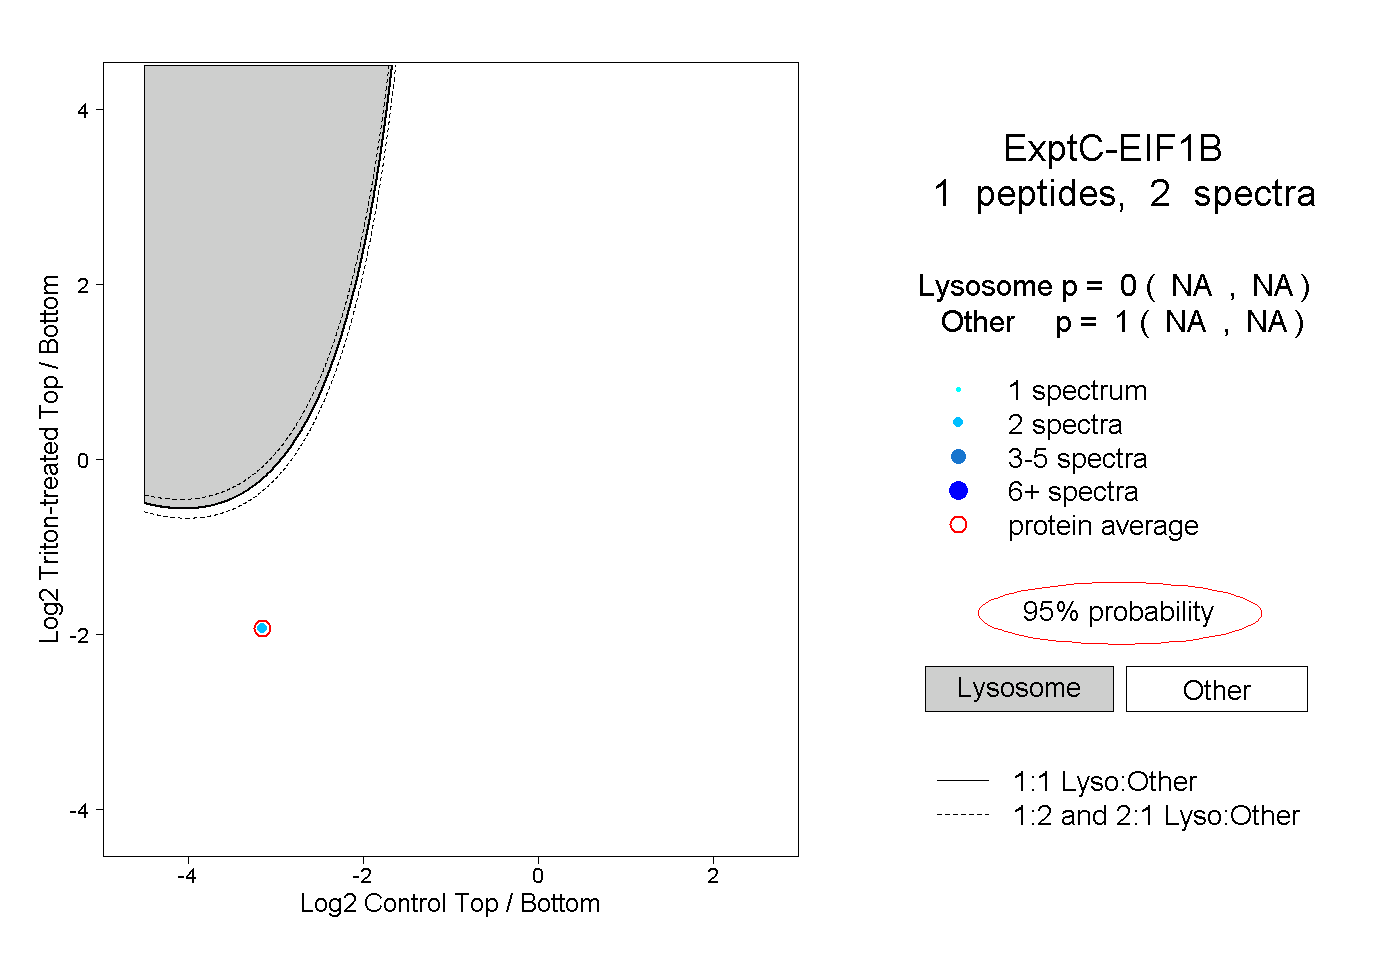
NA | NA
NA | NA