 3
3peptides
spectra
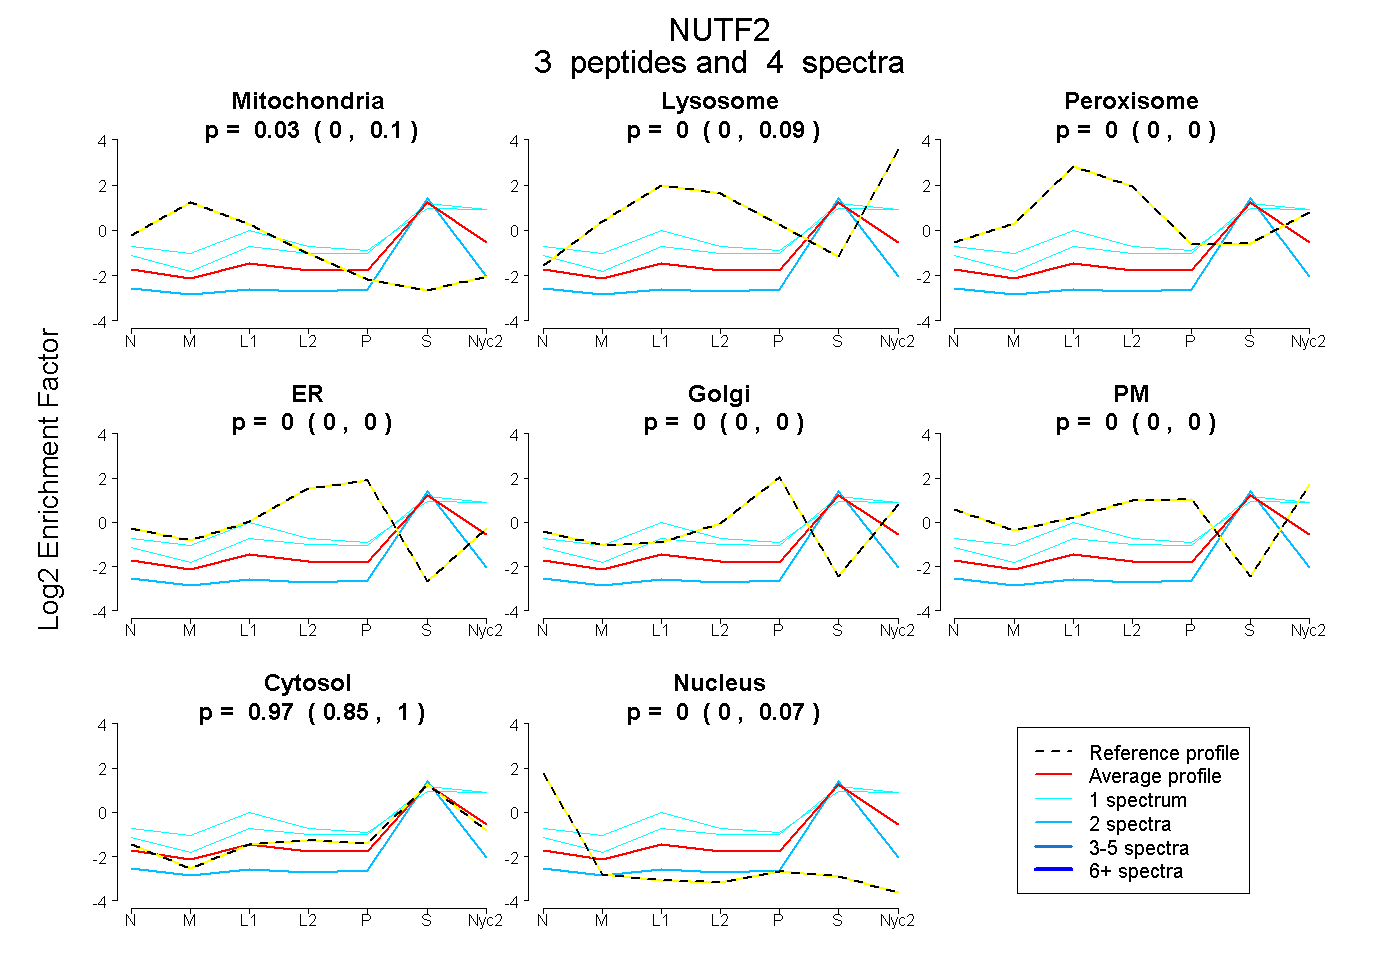
0.000 | 0.099
0.000 | 0.093
0.000 | 0.000
0.000 | 0.000
0.000 | 0.000
0.000 | 0.000
0.845 | 1.000
0.000 | 0.074
1peptide
spectra
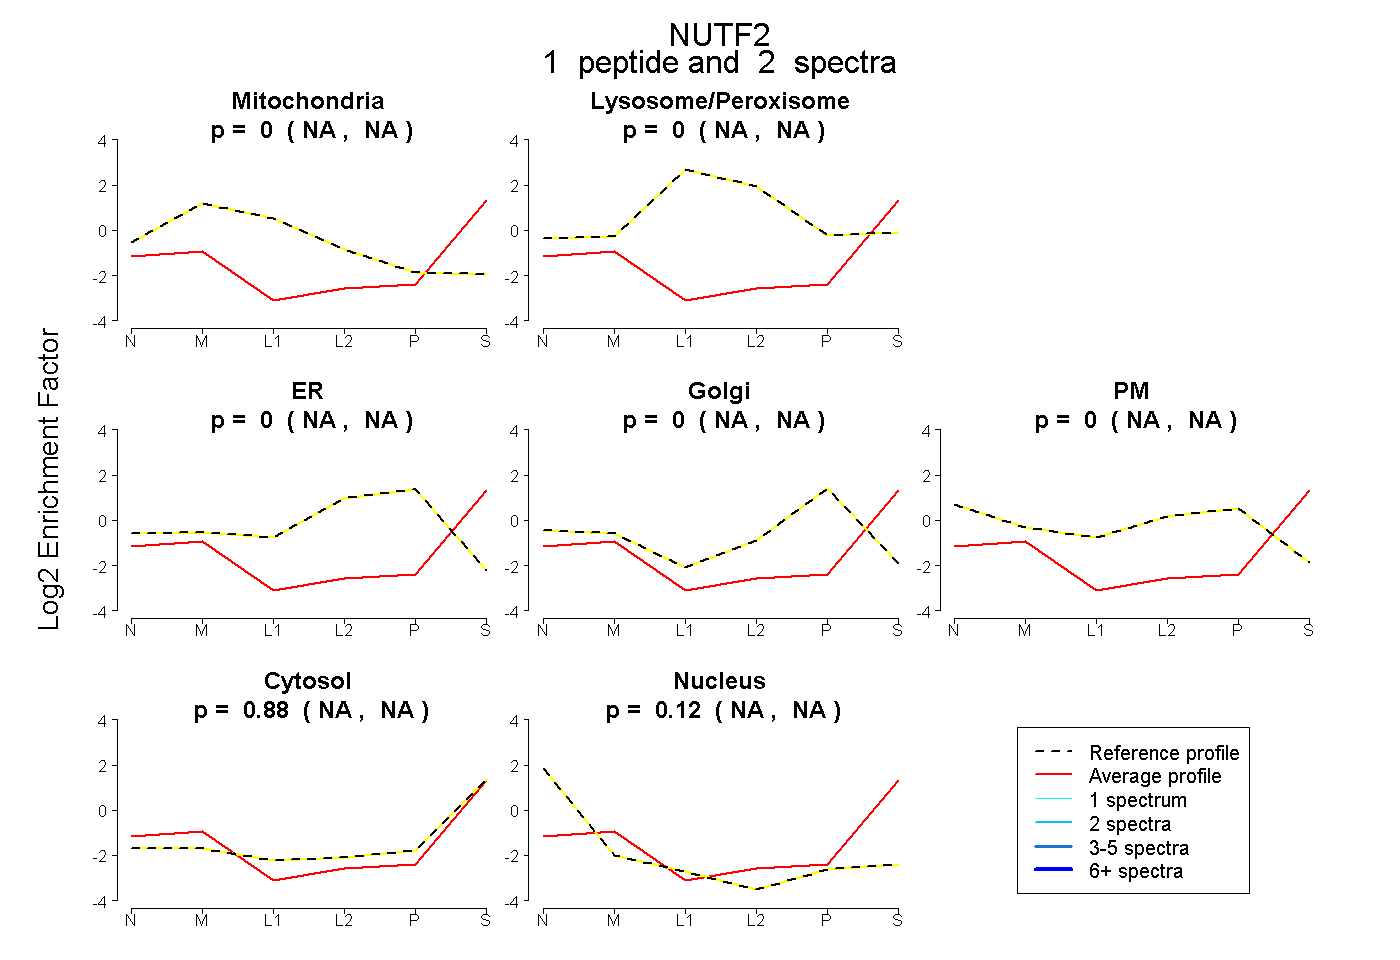
NA | NA
NA | NA
NA | NA
NA | NA
NA | NA
NA | NA
NA | NA
3peptides
spectra

0.000 | 0.015
0.985 | 1.000