1
1peptide
spectra
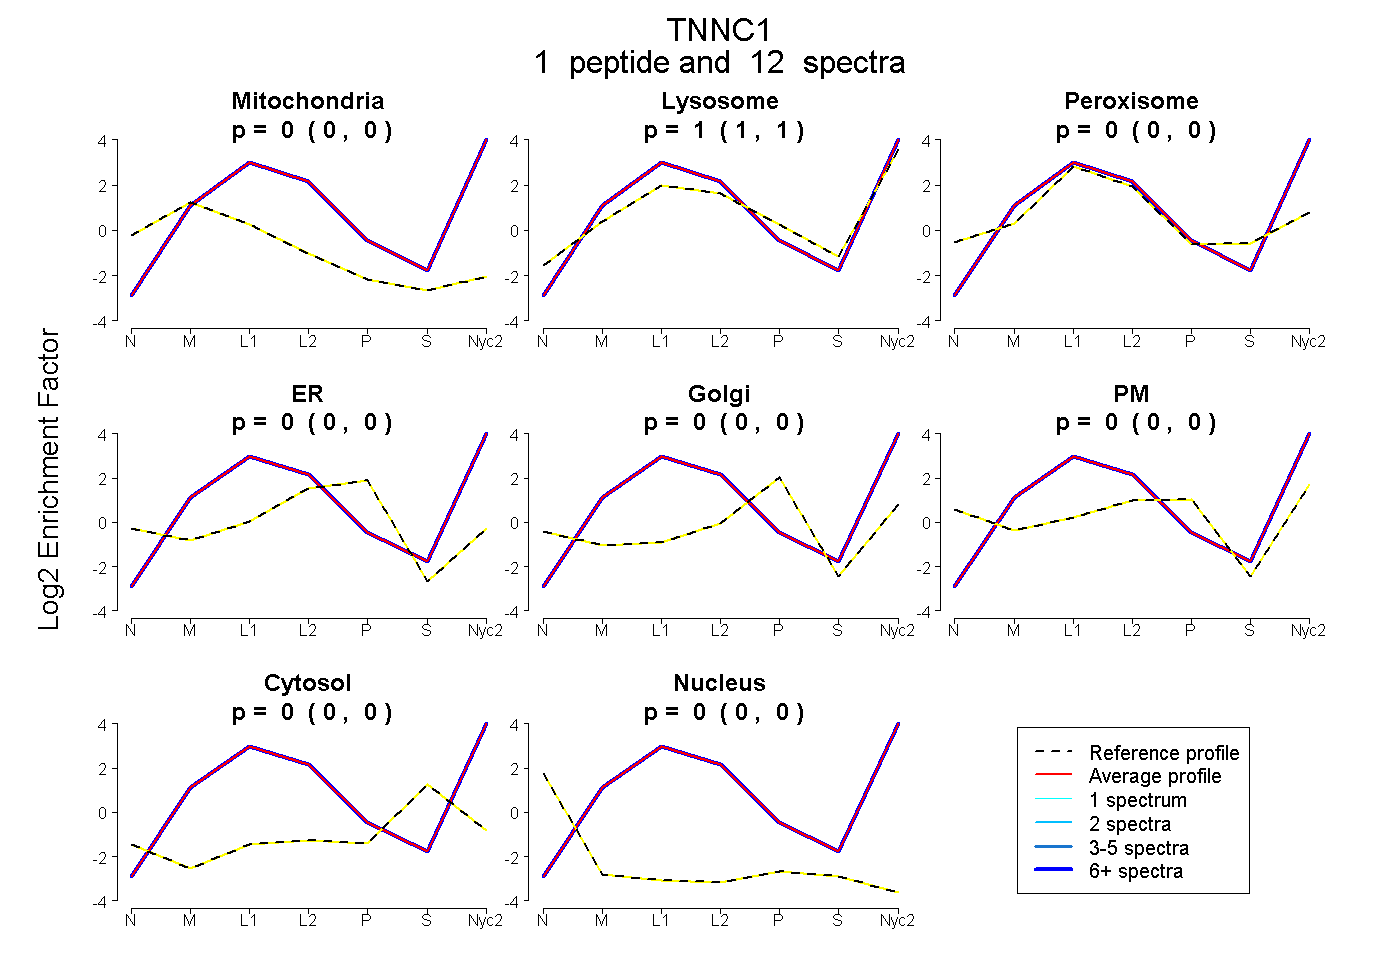
0.000 | 0.000
1.000 | 1.000
0.000 | 0.000
0.000 | 0.000
0.000 | 0.000
0.000 | 0.000
0.000 | 0.000
0.000 | 0.000
1peptide
spectra

0.000 | 0.000
1.000 | 1.000
0.000 | 0.000
0.000 | 0.000
0.000 | 0.000
0.000 | 0.000
0.000 | 0.000
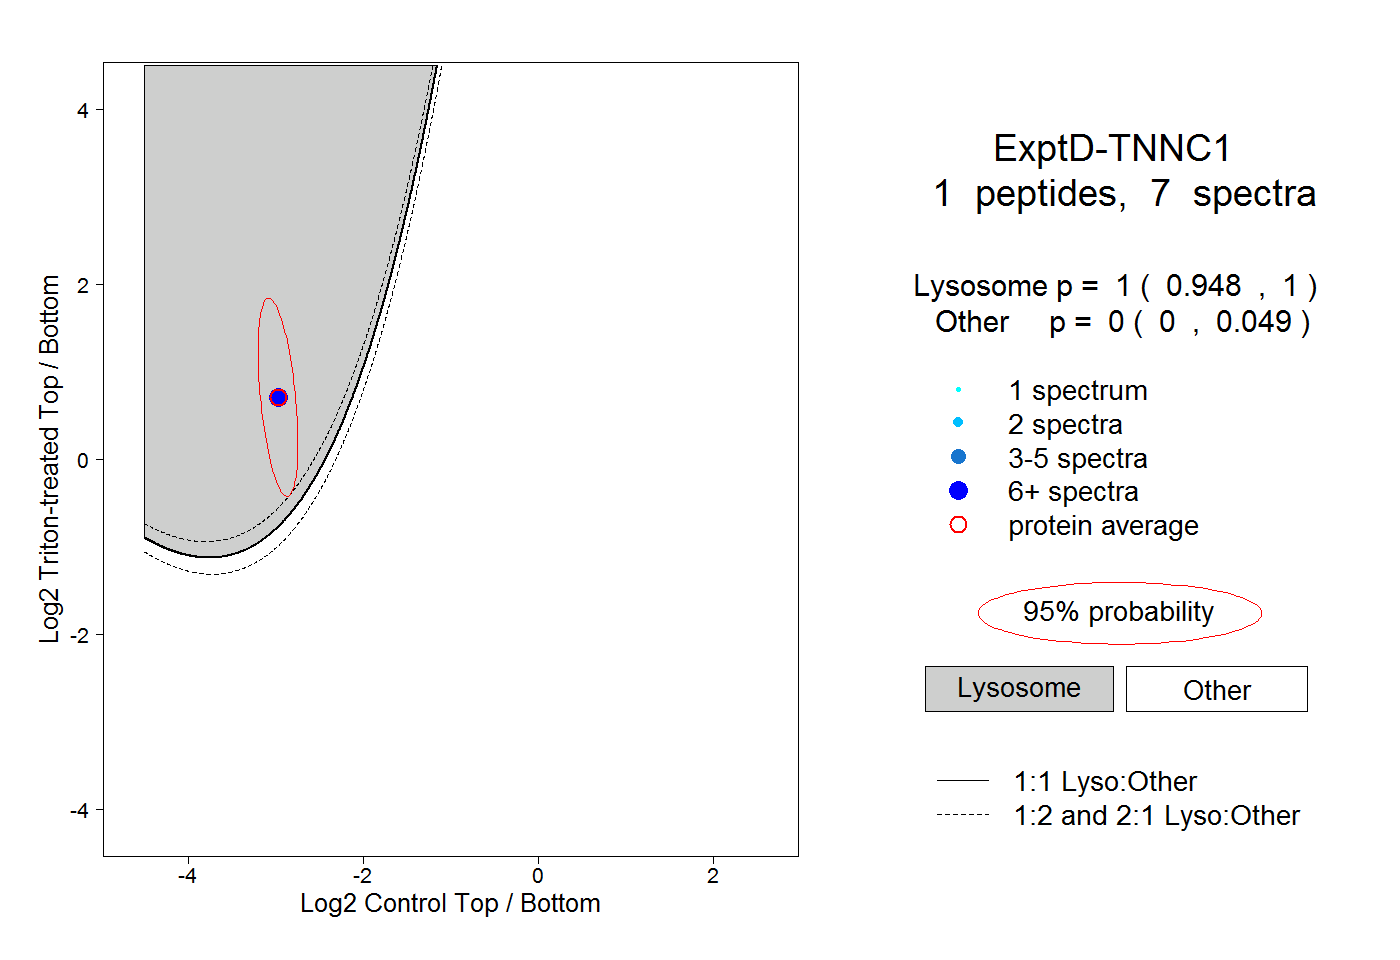
1peptide
spectra
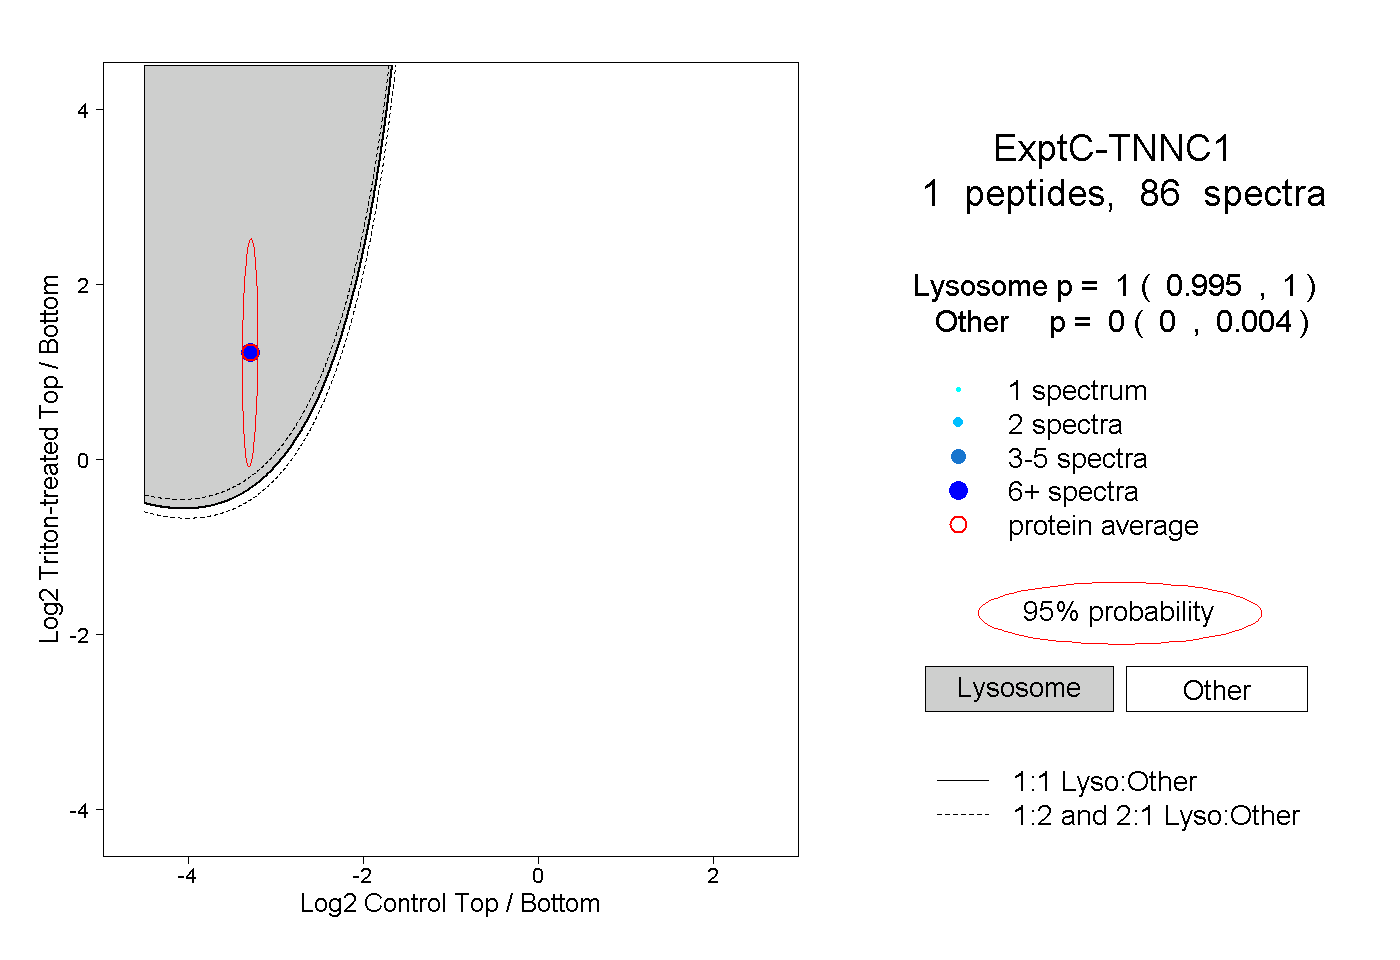
0.995 | 1.000
0.000 | 0.004