 4
4peptides
spectra
0.000 | 0.055
0.000 | 0.000
0.000 | 0.000
0.000 | 0.000
0.000 | 0.235
0.000 | 0.150
0.131 | 0.396
0.458 | 0.648
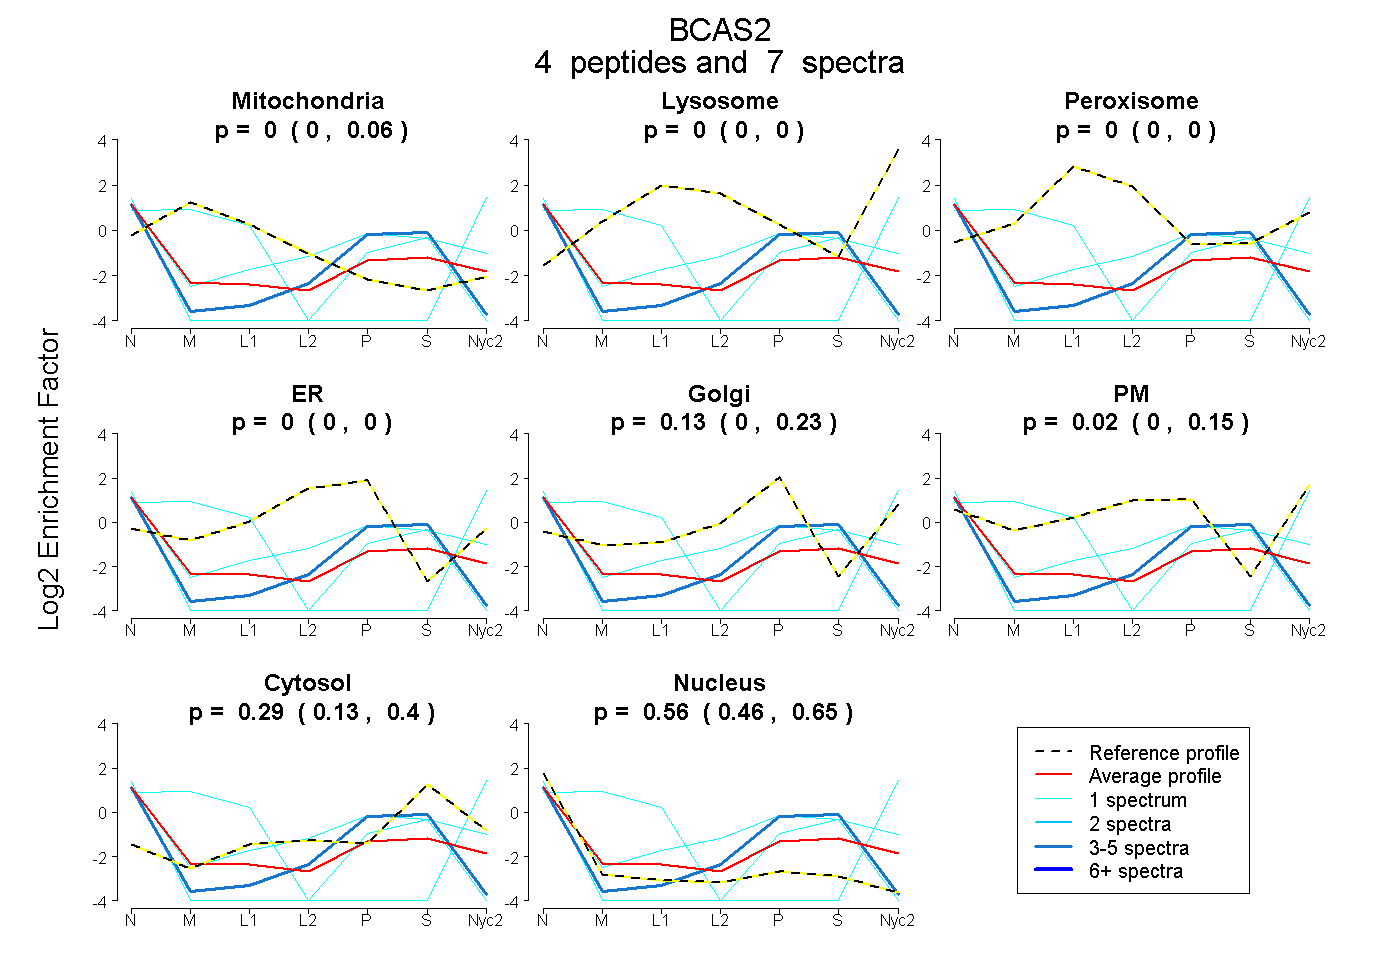
| Plot | Mito | Lyso | Perox | ER | Golgi | PM | Cytosol | Nucleus | |||||
| Expt A |
4 peptides |
7 spectra |
|
0.000 0.000 | 0.055 |
0.000 0.000 | 0.000 |
0.000 0.000 | 0.000 |
0.000 0.000 | 0.000 |
0.128 0.000 | 0.235 |
0.021 0.000 | 0.150 |
0.288 0.131 | 0.396 |
0.563 0.458 | 0.648 |
| 4 spectra, VYNENLVHMIEHAQK | 0.000 | 0.000 | 0.000 | 0.000 | 0.000 | 0.000 | 0.401 | 0.599 | ||
| 1 spectrum, TIVQLENEIYQIK | 0.000 | 0.000 | 0.000 | 0.000 | 0.000 | 0.000 | 0.221 | 0.779 | ||
| 1 spectrum, HIQDLNWQR | 0.600 | 0.165 | 0.000 | 0.000 | 0.000 | 0.000 | 0.000 | 0.235 | ||
| 1 spectrum, QPIELLSMK | 0.000 | 0.000 | 0.000 | 0.000 | 0.151 | 0.169 | 0.392 | 0.288 |