31
31peptides
spectra
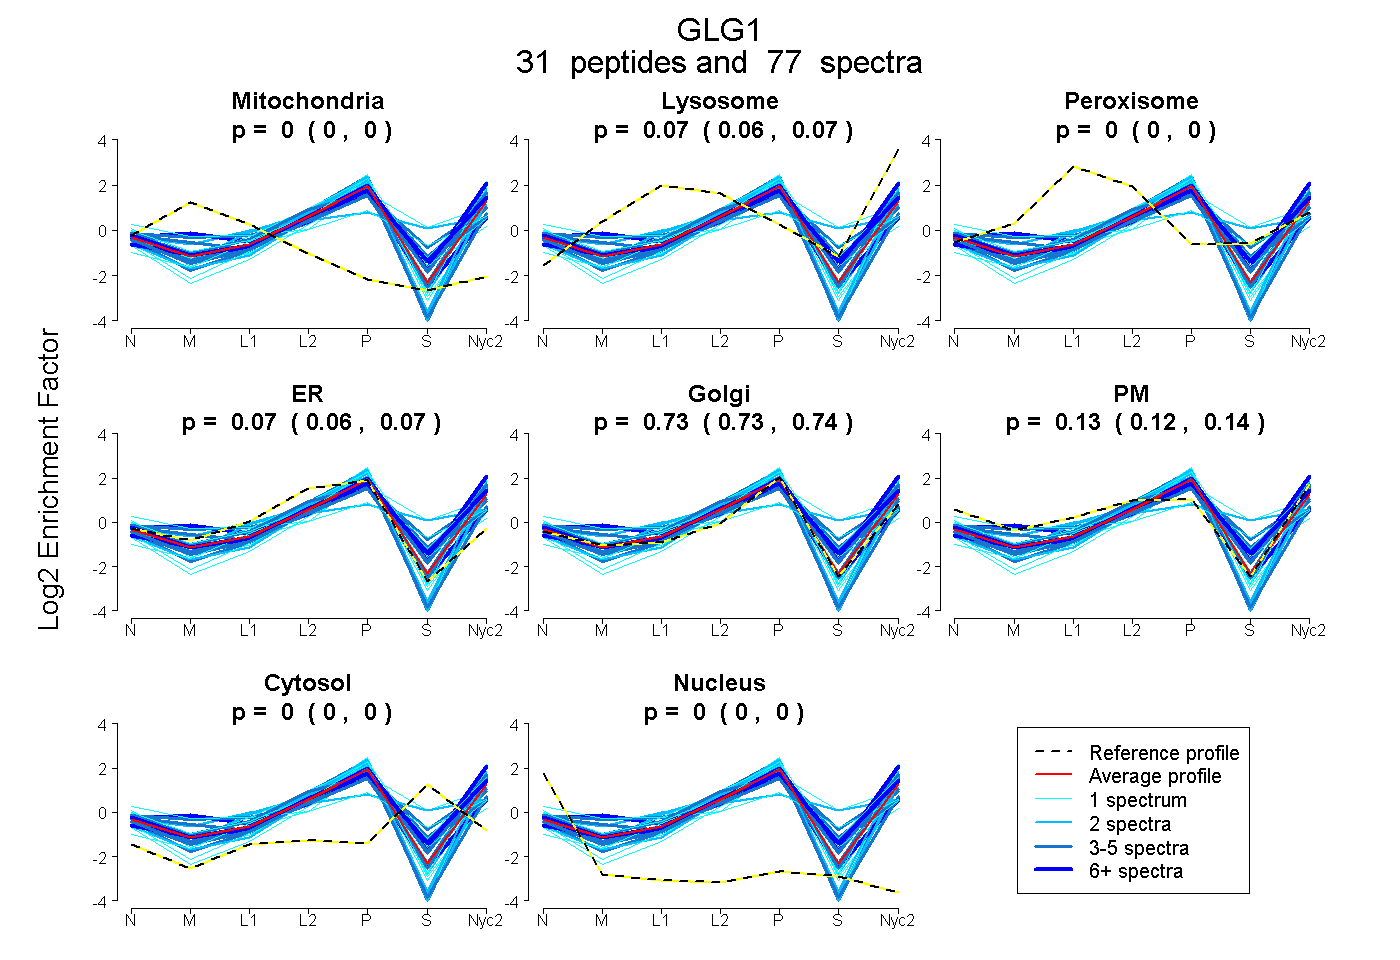
0.000 | 0.000
0.061 | 0.072
0.000 | 0.000
0.057 | 0.072
0.727 | 0.740
0.124 | 0.144
0.000 | 0.000
0.000 | 0.000
9peptides
spectra
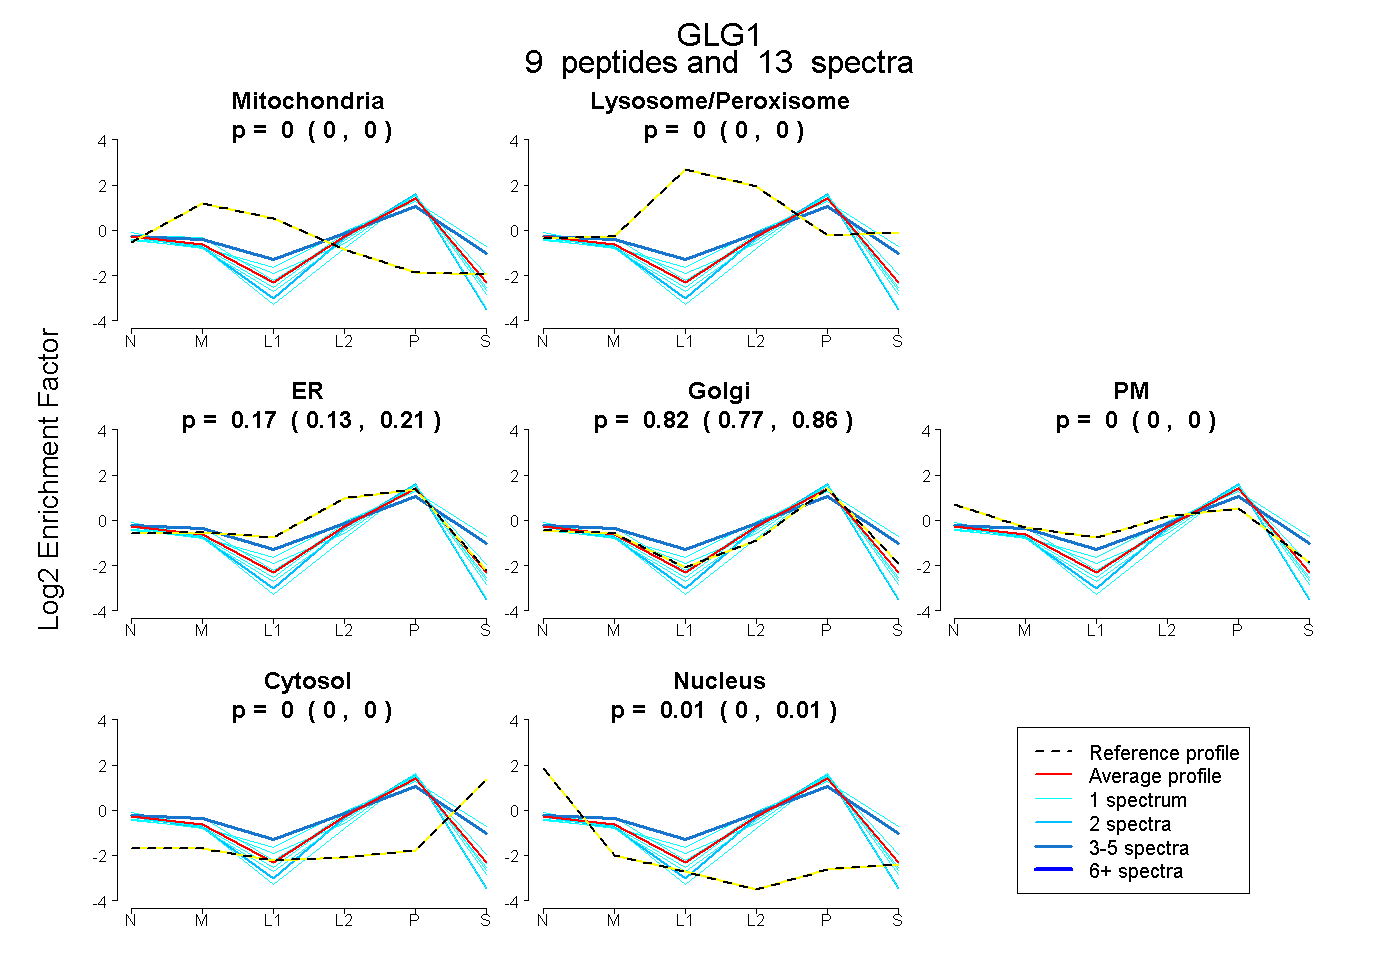
0.000 | 0.000
0.000 | 0.000
0.135 | 0.208
0.772 | 0.856
0.000 | 0.000
0.000 | 0.000
0.000 | 0.015