 7
7peptides
spectra
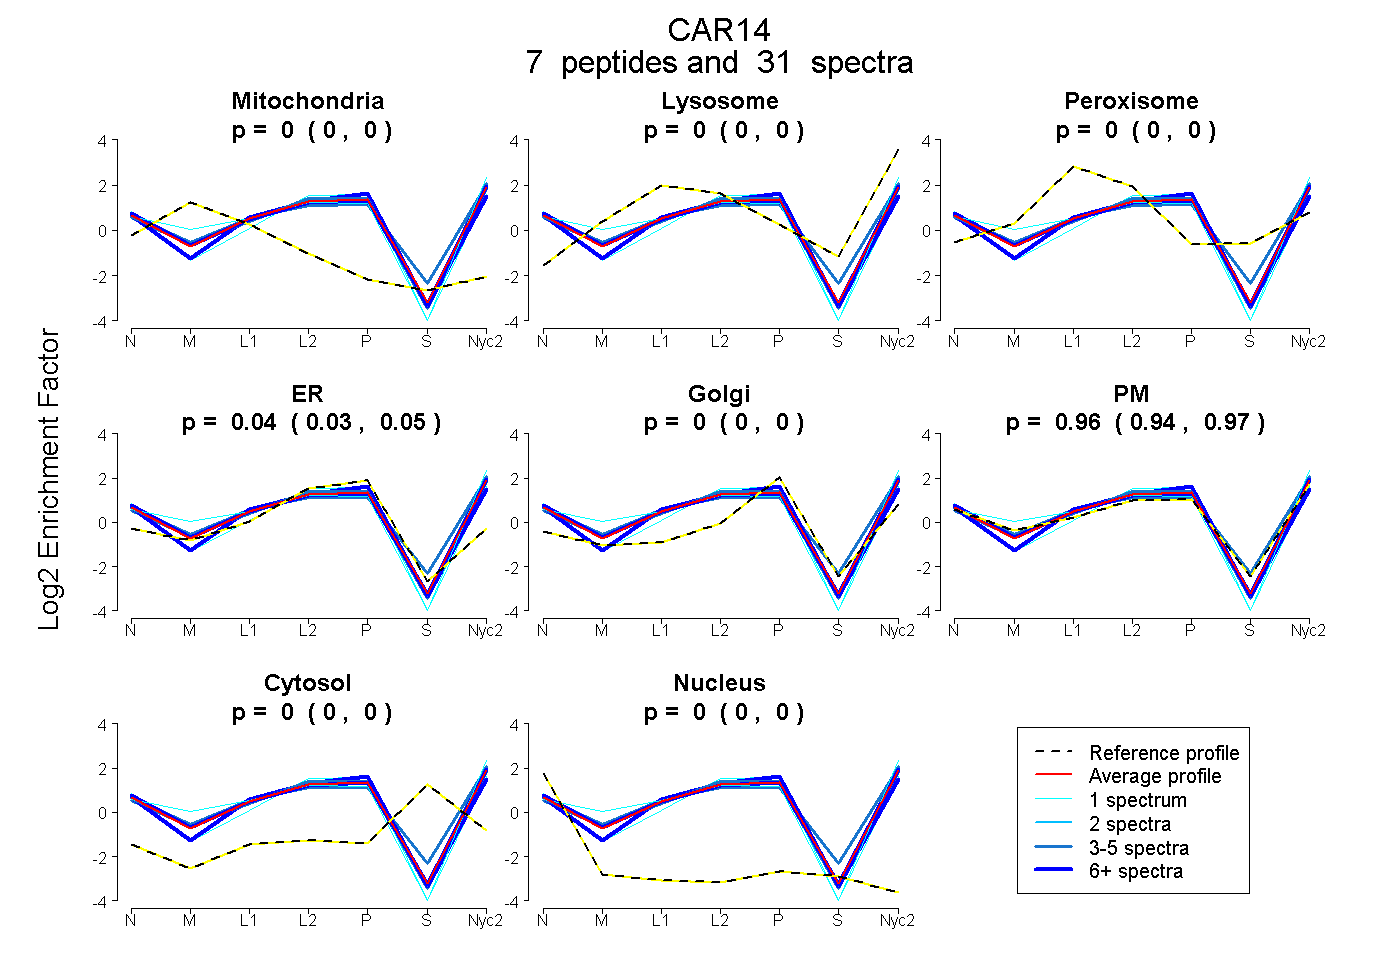
0.000 | 0.000
0.000 | 0.000
0.000 | 0.000
0.028 | 0.053
0.000 | 0.000
0.944 | 0.969
0.000 | 0.000
0.000 | 0.000
4peptides
spectra
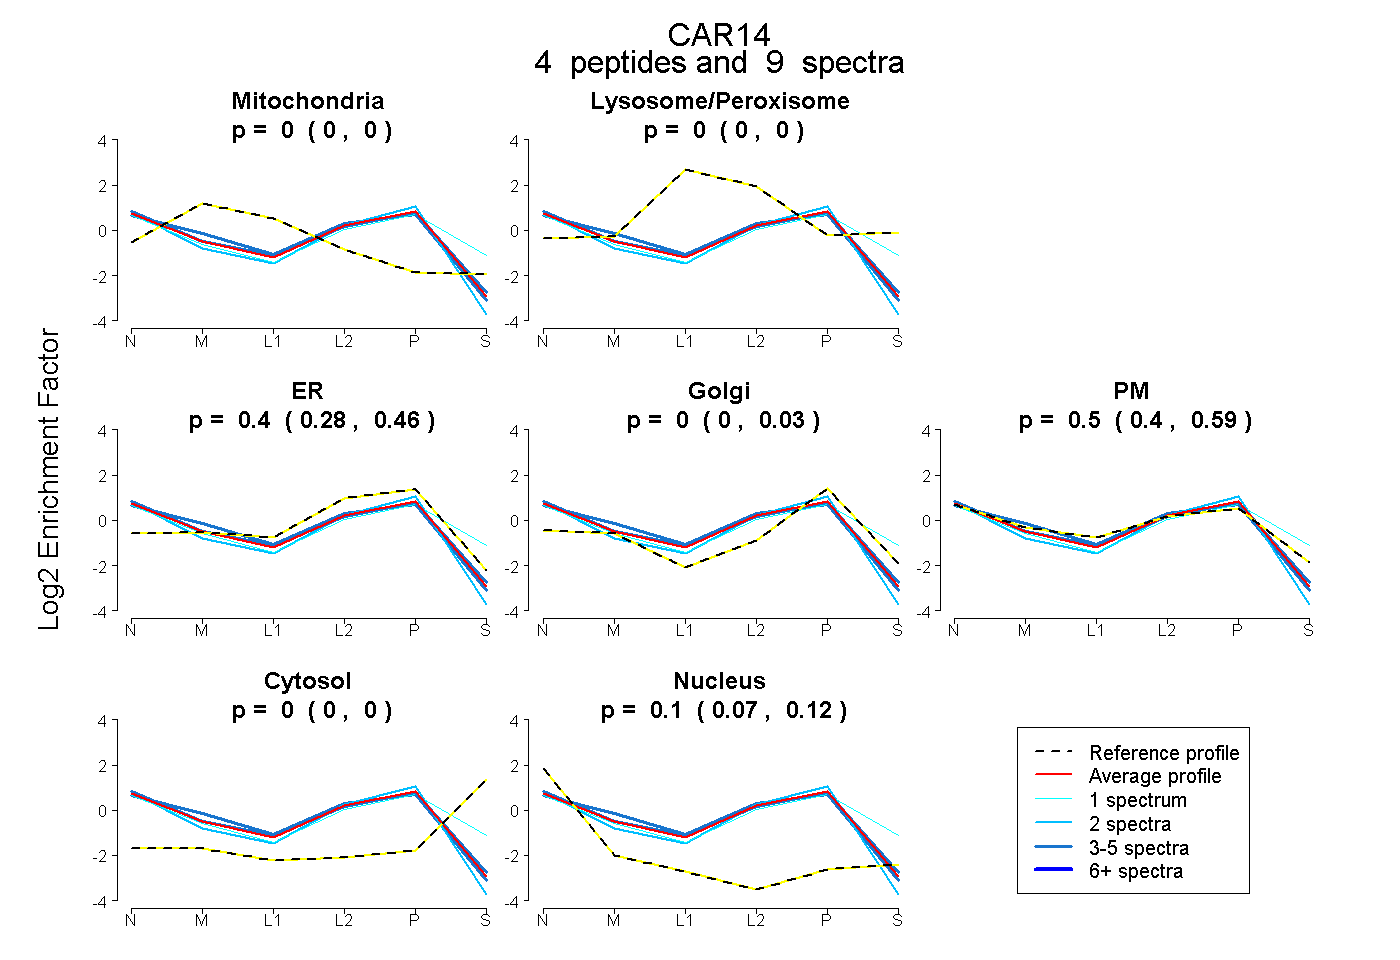
0.000 | 0.000
0.000 | 0.000
0.284 | 0.463
0.000 | 0.034
0.399 | 0.588
0.000 | 0.000
0.066 | 0.122
6peptides
spectra
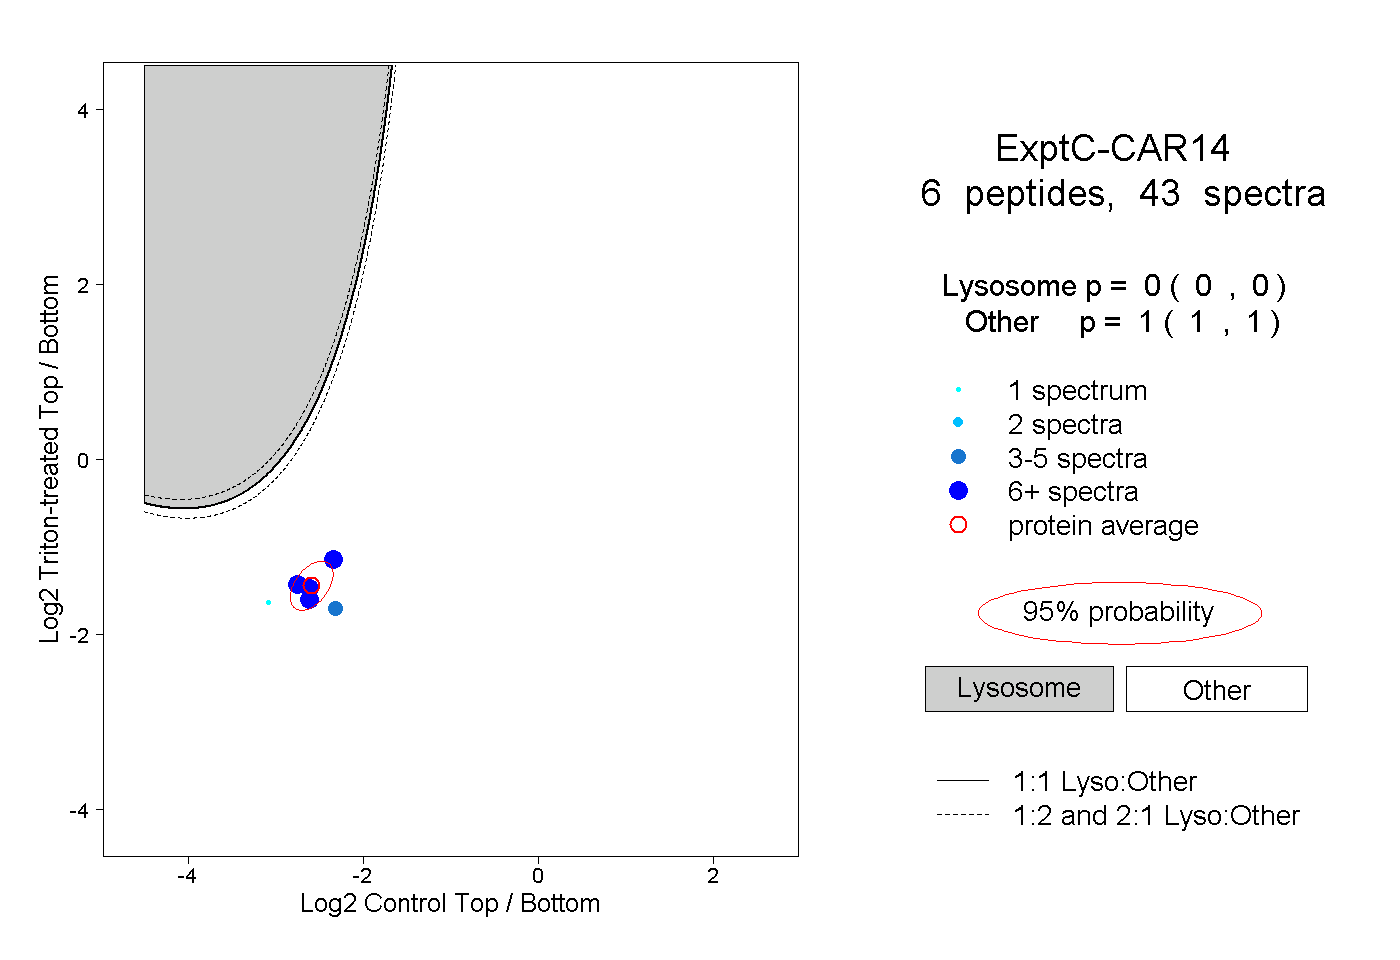
0.000 | 0.000
1.000 | 1.000
5peptides
spectra
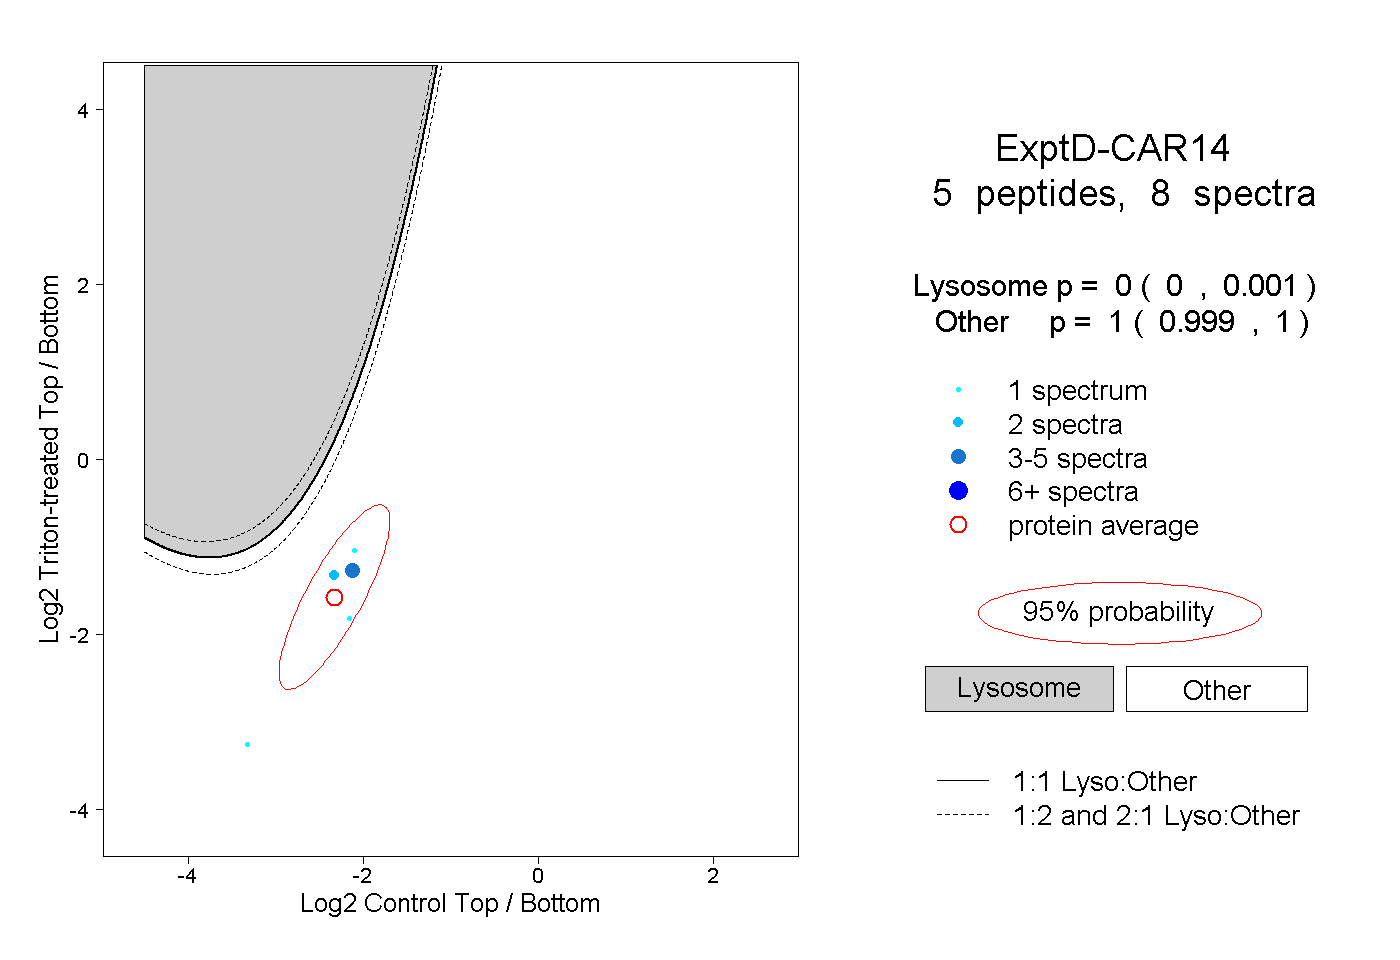
0.000 | 0.001
0.999 | 1.000